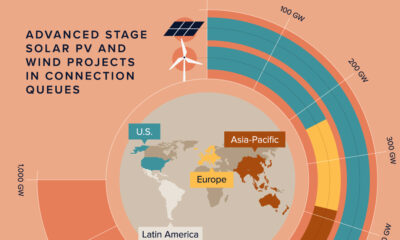

Streamlining processes, investing in infrastructure, and promoting local manufacturing can pave the way for wind and solar adoption.
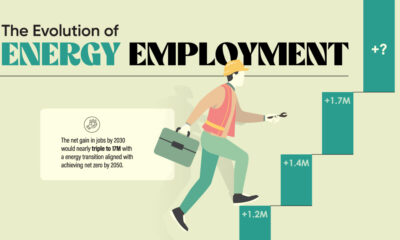

This graphic shows the projected evolution of global energy employment between 2022 and 2030 using data by the International Energy Agency.
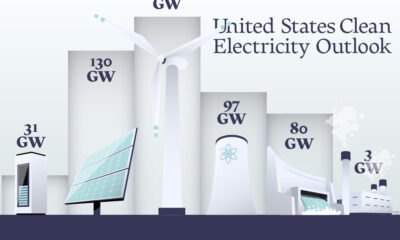

In this graphic, we explore the projected generation capacity of different clean electricity technologies in the U.S. for 2023 and 2024.
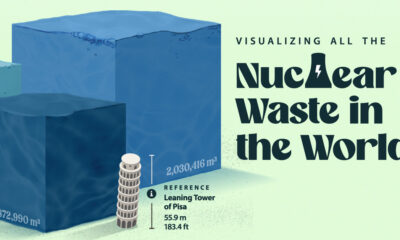

Despite concerns about nuclear waste, high-level radioactive waste constitutes less than 0.25% of all radioactive waste ever generated.


In this infographic, we discuss three ways hydrogen can support the decarbonization of the global electricity sector.
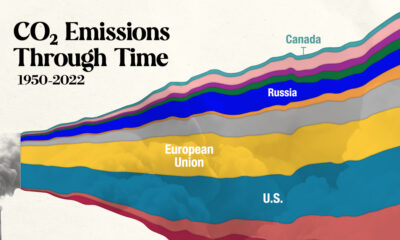

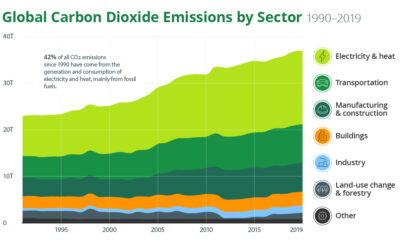
In this streamgraph, we break down global CO2 emissions between 1950 and 2022 using data from Berkeley Earth and Global Carbon Project.
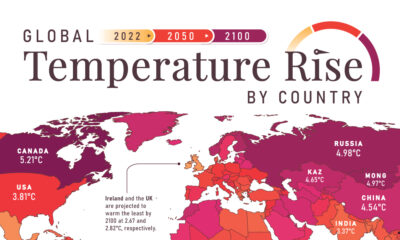

In this set of three maps, we show the global temperature rise on a national level for 2022, 2050, and 2100 based on an analysis by...
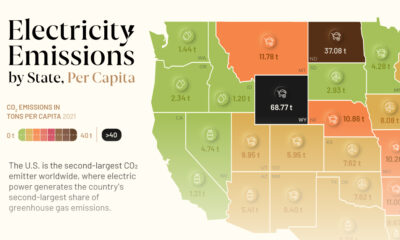

This graphic showcases electricity emissions by state, highlighting each state's largest source of power.
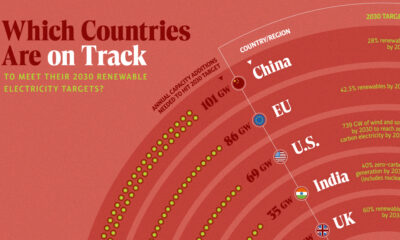

In this graphic, we visualize whether major electricity-consuming countries are on track to meet their 2030 renewable energy targets.


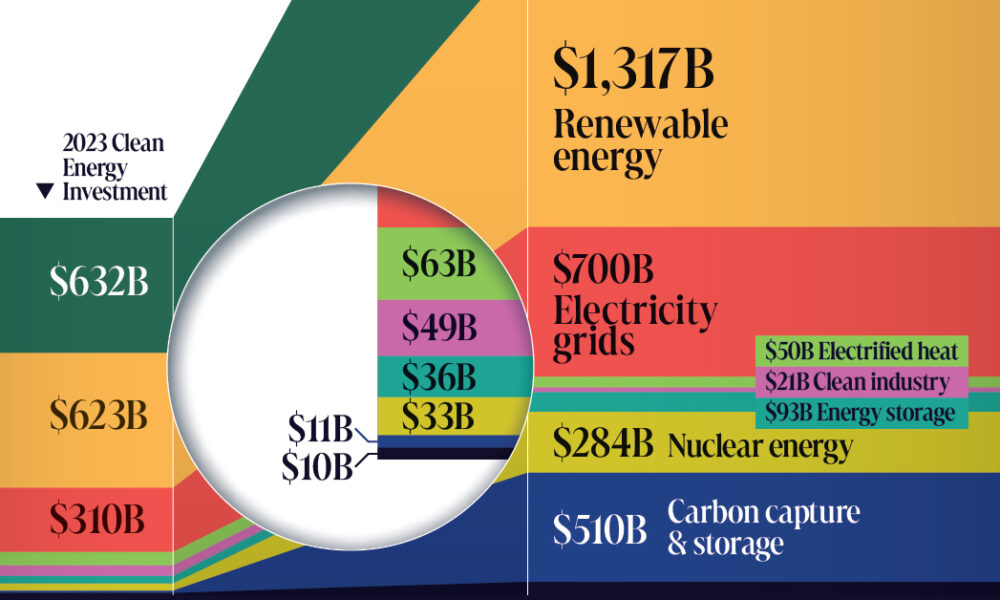
The clean energy transition will cost $110 trillion in global capital investments between 2021 and 2050. Here's that sum broken down by sector.
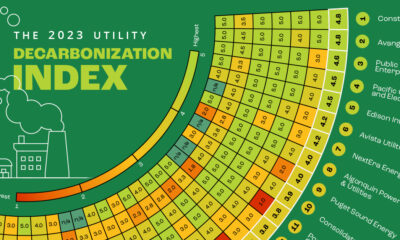

Here is a preview of our 2023 Utility Decarbonization Index, which tracks the decarbonization progress of the largest investor-owned utilities in America.
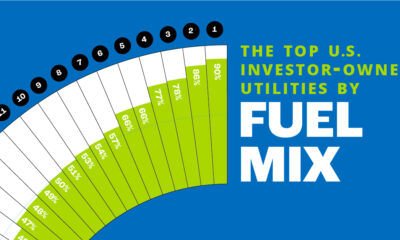

In this chart, we rank the top U.S. utilities by the share of low-carbon sources in their owned electricity generations.
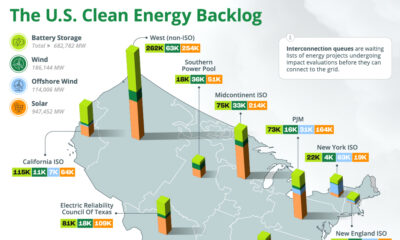

The U.S. has almost 2 million megawatts of clean energy capacity on hold in interconnection queues, seeking connection to the grid.
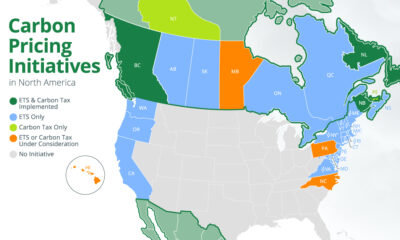

We map out all of the national and subnational carbon pricing initiatives in North America using data from the World Bank.


Can the transition from fossil fuels to clean, emission-free electricity sources be accomplished in a financially viable manner?
This infographic tracks the extent of electrification in the residential, commercial, industrial, and transportation sectors.
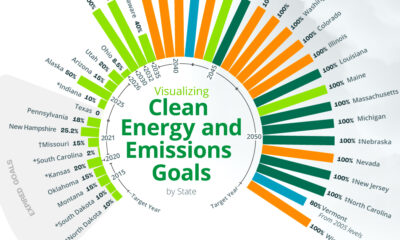

An overview of each U.S. state’s ultimate clean energy or GHG emission reduction goal, broken down by goal type and target year.
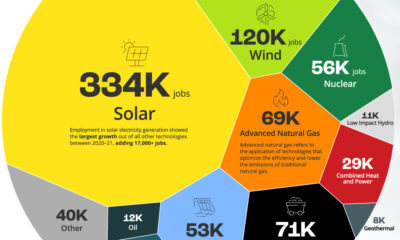

Exploring U.S. electricity generation jobs by technology with a focus on renewable energy and workforce development.
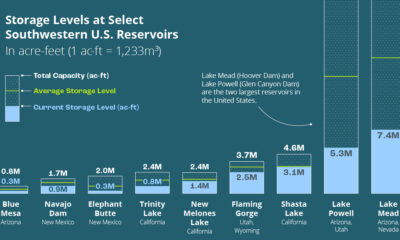

This infographic explores how droughts are affecting U.S. hydroelectric generation and the future of hydropower.
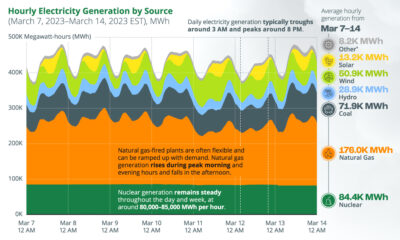

This chart tracks U.S. hourly electricity generation over one week, with various sources producing electricity at different times of the day.
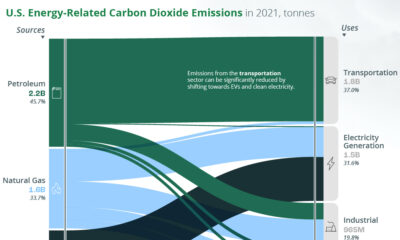

A look at the flow of energy-related CO2 emissions from the sources that generate energy to the sectors that use it.


In this animated chart, we explore the past 70 years of U.S. electricity generation by source.
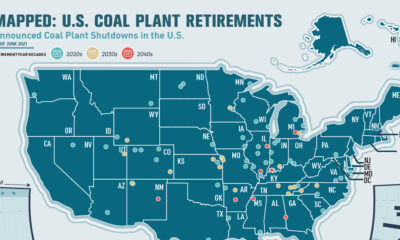

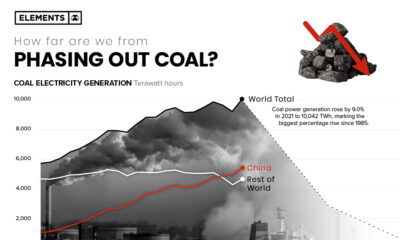
This infographic highlights announced coal plant closures in the U.S. and how much power will be affected.
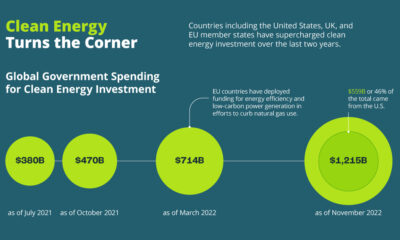

See how the energy crisis of 2022 accelerated the growth of clean energy.


This graphic breaks down the $392.5 billion in clean energy funding in the Inflation Reduction Act of 2022.

How can the U.S. achieve a 100% clean power sector? See the three key pillars of a decarbonized power sector in this infographic.


Hydropower accounts for one-third of U.S. renewable power generation. Here are the 30 largest U.S. hydropower plants.

What is the current state of the climate change crisis, and how can we mitigate it? Find out in this infographic.


How does electricity get from the power plant to our homes? This infographic illustrates how the power grid works.
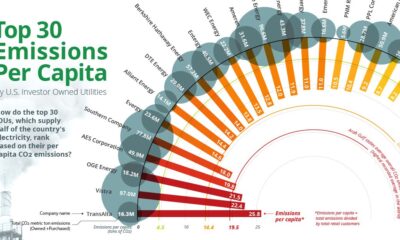

Emissions per Capita of the Top 30 U.S. Investor-Owned Utilities Approximately 25% of all U.S. greenhouse gas emissions (GHG) come from electricity generation. Subsequently, this means...
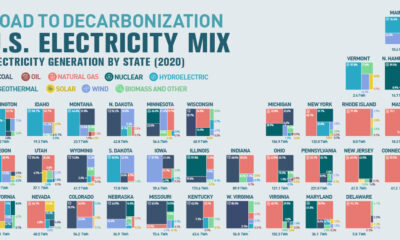

Road to Decarbonization: The United States Electricity Mix This was originally posted on August 31, 2021, on Visual Capitalist. The U.S. response to climate change and...


The U.S. Utilities Decarbonization Index With the Biden administration targeting a zero-emissions power sector for the U.S. by 2035, how are the nation’s largest electric power...
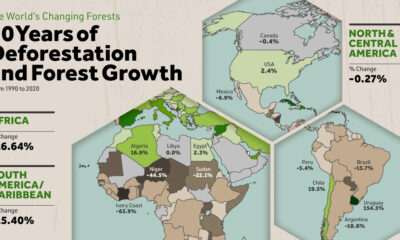

Global Deforestation and Forest Growth over 30 Years This was originally published on December 29, 2021, on Visual Capitalist. Forests are the great carbon capturers of...
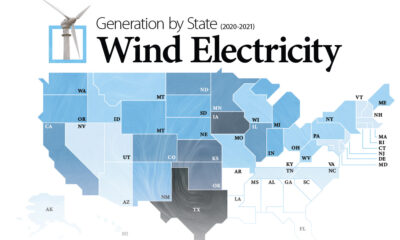

Mapping U.S. Wind Energy by State This was originally published on April 25, 2022, on Elements. Wind power is the most productive renewable energy source in...


Highest Per Capita CO2 Emissions This was originally published on December 1, 2021, on Visual Capitalist. Developing countries like China, India, and Russia are some of...
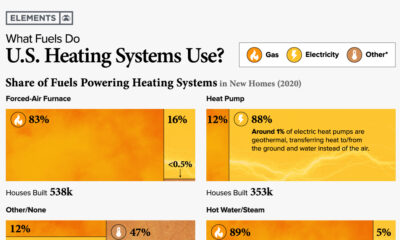

Charted: Home Heating Systems in the U.S. This was originally published on April 25, 2022, on Elements. Fossil fuel combustion for the heating of commercial and...

More carbon in the atmosphere is creating a hotter world—and gradually fuelling both climate change and instances of wildfires.
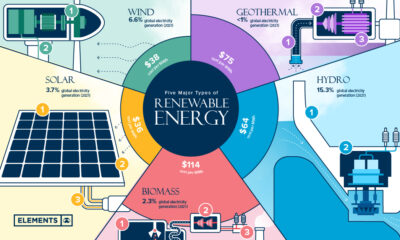

Renewable energy is the foundation of the ongoing energy transition. What are the key types of renewable energy, and how do they work?
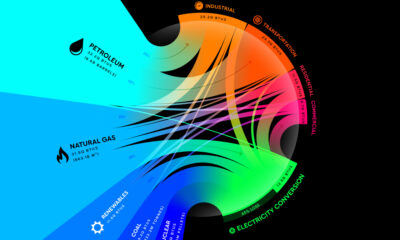

Breaking Down America’s Energy Consumption in 2020 This was originally published on July 6 2021, on Visual Capitalist. The United States relies on a complex mix...
This infographic shows all of America's 92 nuclear reactors.
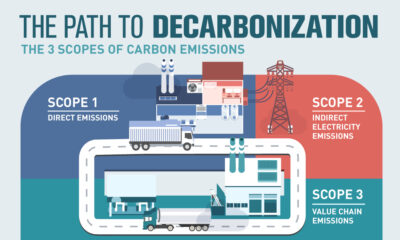

What Carbon Emissions Are Part Of Your Footprint? This was originally posted on April 9, 2021, on Visual Capitalist. With many countries and companies formalizing commitments...
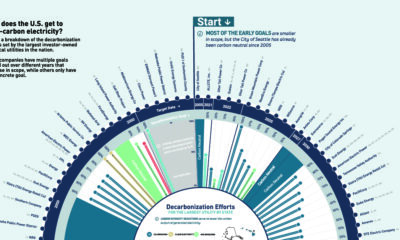

Decarbonization Targets for the Largest U.S. Utilities This was originally posted on April 23, 2021, on Visual Capitalist. The U.S. recently rejoined the Paris Climate Agreement...
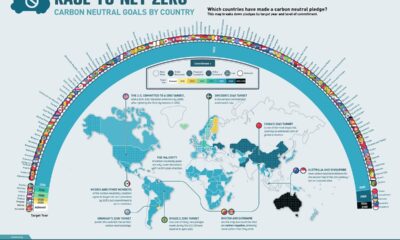

Race to Net Zero: Carbon Neutral Goals by Country This was originally posted on July 8, 2021, on Visual Capitalist. The time to talk about net...
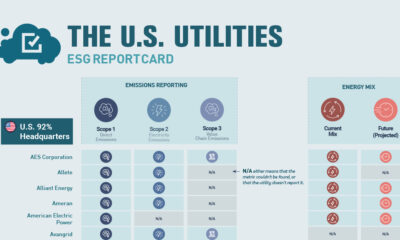

Tracked: The U.S. Utilities ESG Report Card This was originally posted on July 15, 2021, on Visual Capitalist. As emissions reductions and sustainable practices become more...
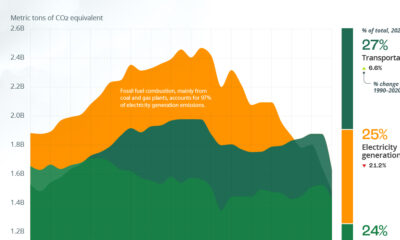

Visualizing U.S. Emissions by Sector Decarbonization efforts in the U.S. are ramping up, and in 2020, greenhouse gas (GHG) emissions were lower than at any point...


More carbon in the atmosphere is creating a hotter world—and gradually fuelling both climate change and instances of wildfires.