Electrification
Visualized: How the Power Grid Works
The following content is sponsored by the National Public Utilities Council
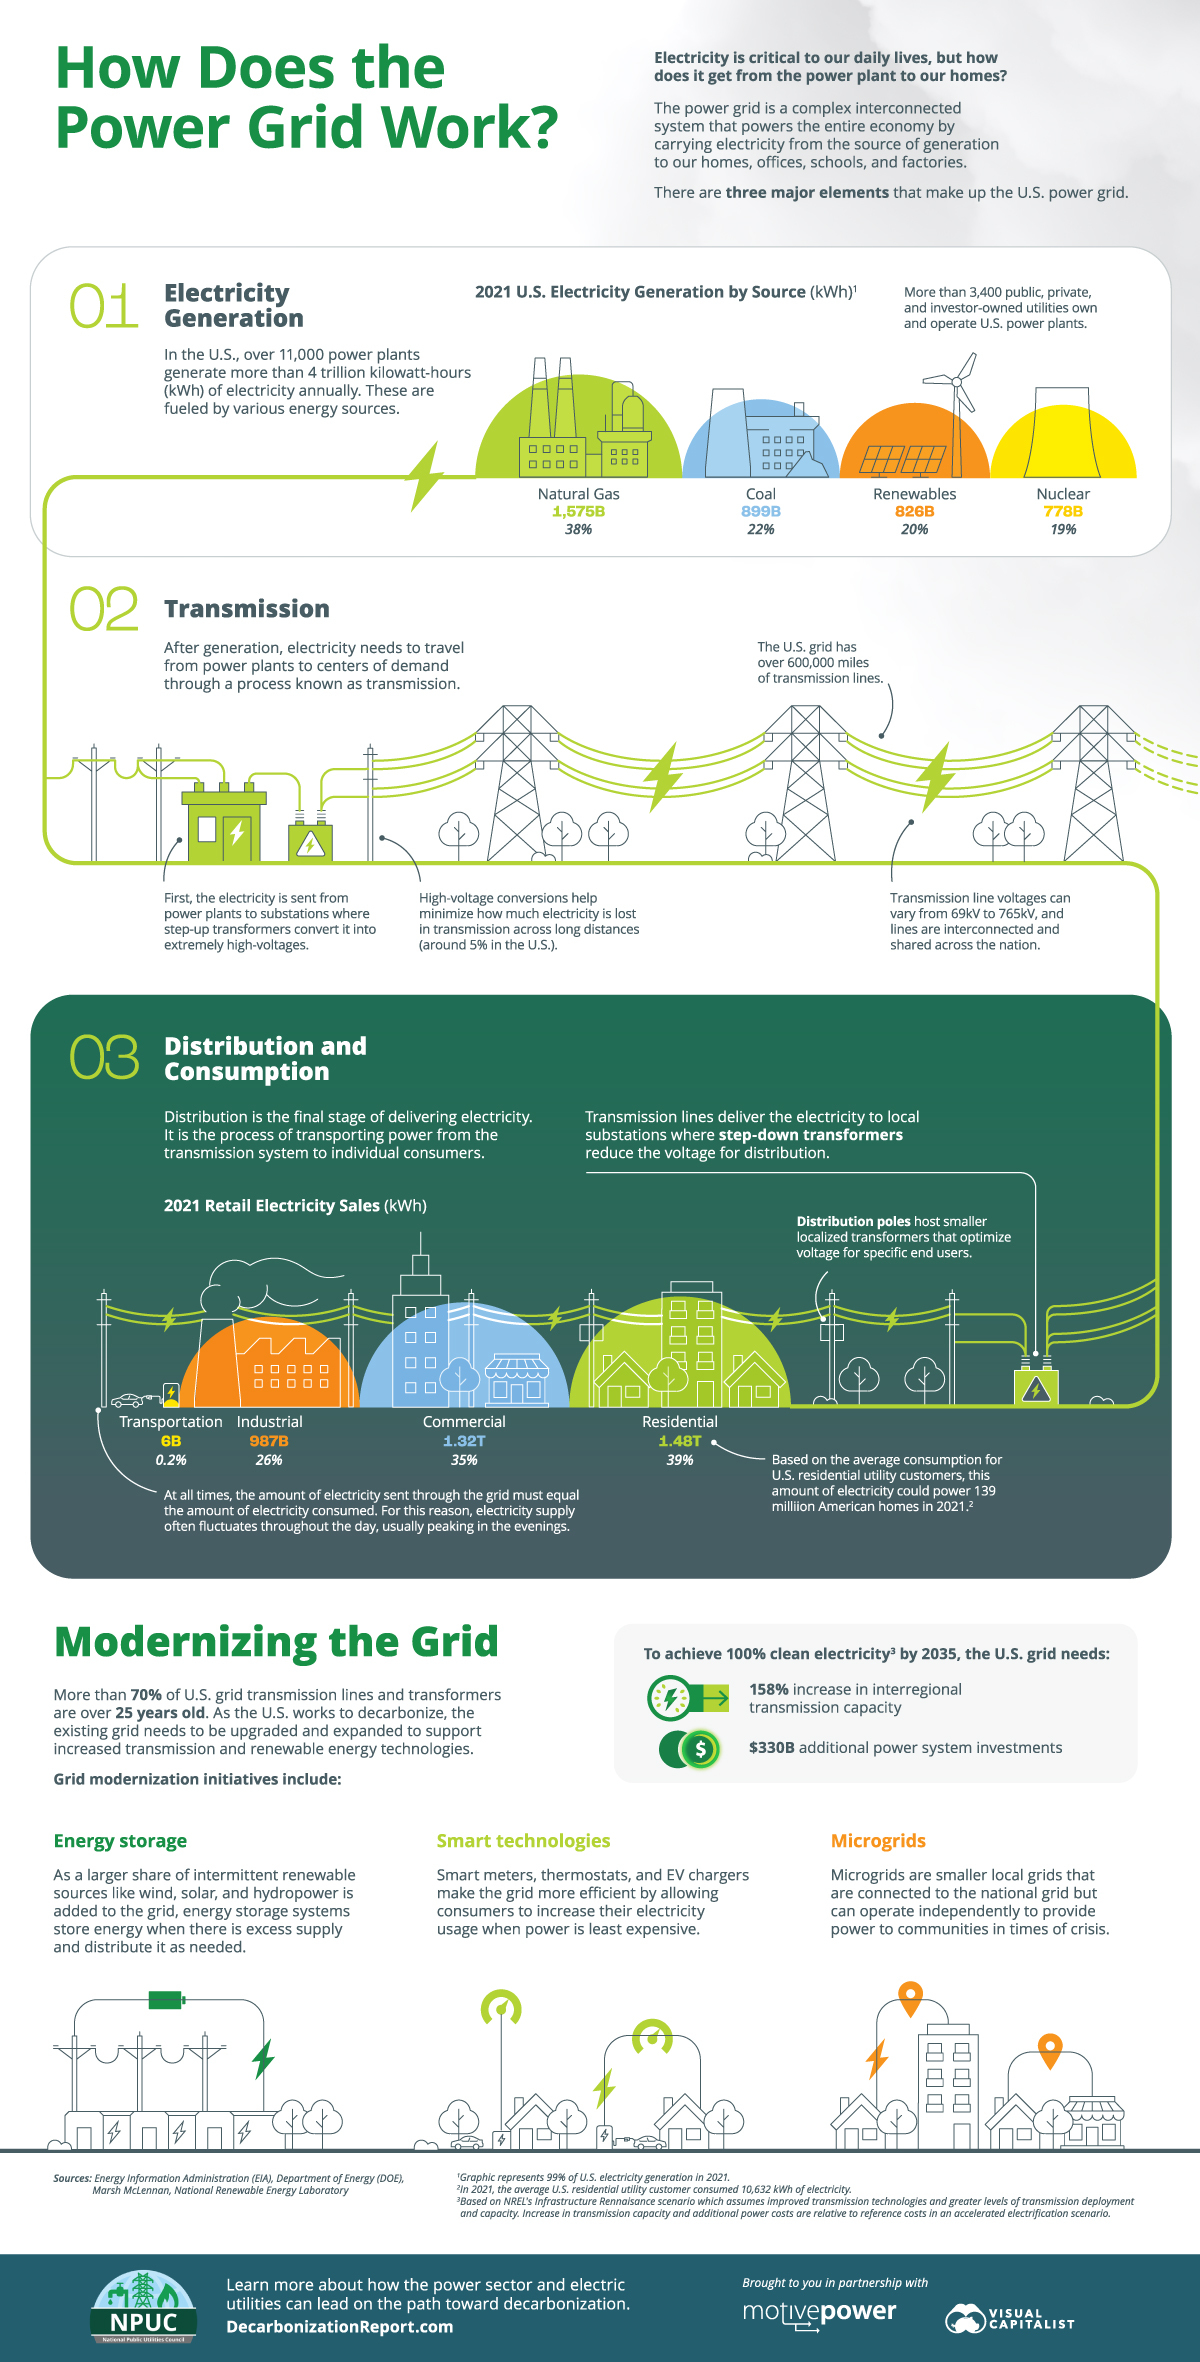
How Does the Power Grid Work?
Electricity is critical to our daily lives, but how does it get from the power plant to our homes?
The power grid is a complex interconnected system that powers the entire economy by carrying electricity from the source of generation and delivering it to our homes, offices, and factories. Sometimes referred to as “the world’s largest machine”, the grid is an important engineering marvel for the modern economy.
The above infographic from the National Public Utilities Council explains how the power grid works and highlights the three key components that make up the grid.
#1: Electricity Generation
The grid begins with power plants that generate electricity, typically owned and operated by public, private, or investor-owned utilities.
More than 11,000 power plants comprise the U.S. grid, generating over 4 trillion kilowatt-hours (kWh) of electricity annually. These are fueled by various energy sources:
| Energy Source | 2021 Electricity Generation (billion kWh) | % of Total |
|---|---|---|
| Natural Gas | 1,575 | 38% |
| Coal | 899 | 22% |
| Nuclear | 778 | 19% |
| Renewables | 826 | 20% |
| Other | 38 | 0.9% |
| Total | 4,116 | 100% |
Source: Energy Information Administration (EIA)
Natural gas and coal together accounted for 60% of annual electricity generation in 2021, followed by nuclear power. Wind was the largest renewable energy source, making up 10% of renewable electricity generation.
Each power generation technology has a different role to play in the larger power grid. For example, coal and nuclear power plants that cannot easily adjust their output are known as baseload power plants. Their output remains roughly the same throughout the day, and they are typically used to deliver the minimum amount of power needed to keep the grid running.
On the other hand, power generation from natural gas and intermittent renewable sources like wind and solar fluctuates throughout the day, typically peaking in the evenings when demand is at its highest. Natural gas plants are especially useful in meeting peaks in demand because their output can be adjusted relatively quickly.
#2: Transmission
After generation, electricity travels from power plants to centers of demand through a process known as transmission.
First, the electricity is sent from power plants to substations where step-up transformers convert it to extremely high voltages for transmission. High-voltage conversions help minimize how much electricity is lost as heat during transmission, which is roughly 5% in the United States. The higher the voltage, the less electricity is lost.
Transmission lines then carry this high-voltage electricity across long distances and are often interconnected across states. Line voltages can vary from 69,000 volts (69 kV) to 765kV, and transmission lines can be both overhead and underground.
Here’s a map of all high-voltage (345kV or greater) U.S. transmission lines:
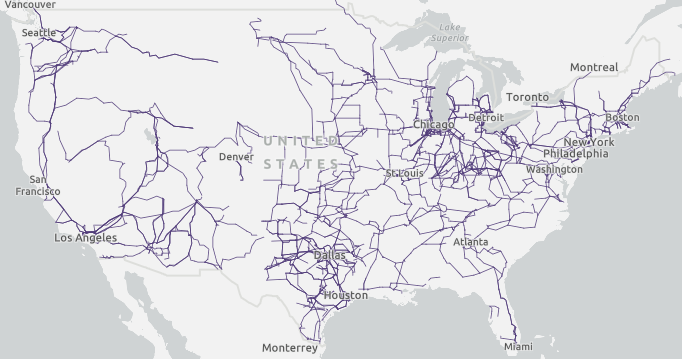
Source: U.S. Energy Atlas
Upgrading and expanding transmission infrastructure is key to achieving a decarbonized power grid, especially as utilities build solar and wind capacity in the sunniest and windiest parts of the country.
#3: Distribution and Consumption
Distribution is the final stage of delivering electricity, making up the last major component of the grid.
Simply put, distribution begins when transmission ends. It is the process of transporting power from the transmission system to individual customers. First, step-down transformers convert the high-voltage power from transmission lines into lower voltages that are suitable for use.
These transformers are connected to distribution poles, which are typically made of wood and used to carry electricity within centers of demand. There are about 180 million distribution poles in the U.S., and it’s likely that you encounter one every day, especially if you live in a city.
Distribution lines and poles deliver electricity to end consumers including households, office buildings, factories, and electric vehicles. Here’s a look at U.S. electricity sales to each end-use sector in 2021:
| Sector | 2021 retail electricity sales (billion kWh) | % of Total |
|---|---|---|
| Residential 🏠 | 1,480 | 39% |
| Commercial 🏢 | 1,320 | 35% |
| Industrial 🏭 | 987 | 26% |
| Transportation 🚙 | 6 | 0.2% |
| Total | 3,793 | 100% |
Source: EIA
Heating and cooling are the largest residential electricity uses. In the commercial sector, refrigeration and computers and office equipment account for over a quarter of electricity use. The transportation sector is by far the smallest electricity consumer, but these figures may change as electric vehicle sales rise.
At all times, the amount of electricity sent through the grid must match demand from end-use sectors. This is because all grids operate at a particular frequency (60 hertz in the United States). Excess power supply or demand can destabilize this frequency, potentially damaging grid infrastructure and triggering blackouts.
Modernizing the Power Grid
Just like machines that get old and need greasing, the U.S. power grid is aging and it needs an upgrade, especially as the power sector works to achieve 100% clean electricity by 2035.
The demand for electricity could accelerate in a scenario with high electrification, which involves switching from fossil fuel-powered technologies to electrical ones. For instance, one form of electrification is switching from gas-powered cars to electric cars.
To meet the growing demand for electricity, especially from clean energy sources, the U.S. will need to expand its transmission capacity and invest in modernizing the grid. In fact, reaching 100% clean electricity by 2035 could require anywhere from $330 billion to $740 billion in additional power system expenditures, according to a study by NREL.
Ultimately, upgrading and decarbonizing the grid are both pivotal to the U.S.’ climate goals, and this requires action from all stakeholders, from electric utilities to the government and end consumers.
The National Public Utilities Council is a collaborative body of industry experts coming together to solve decarbonization challenges in the power sector and the proud sponsor of the Decarbonization Channel.
Electrification
Tracking U.S. Electrification, by Sector
This infographic tracks the extent of electrification in the residential, commercial, industrial, and transportation sectors.
Tracking U.S. Electrification, by Sector
Electrification refers to the process of replacing systems that run on fossil fuels with those powered by electricity.
Electrification can take different forms for each economic sector. For example, in transportation, replacing gas vehicles with EVs is a form of electrification. In homes and offices, it can involve switching from natural gas heating systems to electric alternatives like heat pumps.
Ultimately, the goal of electrification is to reduce greenhouse gas emissions, as electricity can be generated from renewable and low-carbon sources.
This infographic sponsored by the National Public Utilities Council tracks the current state of electrification in the United States, by sector, based on data from the Energy Information Administration (EIA).
The Most and Least Electrified Sectors
Before diving into the data, it’s important to understand the four energy-consuming sectors and what they comprise:
- Residential: Consists of homes, buildings, and living quarters that house private households.
- Commercial: Includes service-providing facilities and equipment of businesses, governments, and other private and public organizations.
- Industrial: Encompasses all facilities and equipment used for producing, processing, or assembling goods. This includes manufacturing, mining, agriculture, and construction.
- Transportation: Consists of all forms of transport including road, rail, marine, and air.
With that context in mind, the table below compares electrified and non-electrified energy usage across these sectors, in quadrillion British thermal units (quads). Electrified consumption refers to energy consumed in the form of electricity, whereas non-electrified includes energy sourced from fossil fuels, biomass, and other fuels.
| Sector | Electrified energy use (quads) | Non-Electrified energy use (quads) | Total (quads) |
|---|---|---|---|
| Commercial | 4.7 | 4.6 | 9.3 |
| Residential | 5.3 | 6.6 | 11.9 |
| Industrial | 3.3 | 23.3 | 26.6 |
| Transportation | 0.06 | 27.9 | 28.0 |
| Total | 13.3 | 62.5 | 75.8 |
The commercial sector leads in electrification with an almost-equal divide between electrified and non-electrified energy consumption. Following closely, the residential sector consumes about 45% of its energy in the form of electricity.
Meanwhile, the industrial and transportation sectors have the most potential for electrification. Overall in the United States, more than 80% of energy consumption is non-electrified.
To understand how these economic sectors are (or aren’t) using electricity, we dive deeper into their end-uses of energy below.
Residential and Commercial Sectors
In both the residential and commercial sectors, space heating is the largest use of energy. In fact, about 50% of all residential energy use is for space heating.
However, natural gas is the primary source of energy for space heating and adds to these sectors’ carbon footprint. Meanwhile, electricity is primarily used for space cooling, refrigeration, lighting, and computing equipment.
Alongside heat pumps for space heating, using electric water heaters, residential solar systems, and energy efficiency measures can help advance residential and commercial electrification.
Industrial Sector
The industrial sector accounts for one-third of U.S. energy consumption, with the majority of energy sourced from fossil fuels. The largest industrial energy consumers—the chemicals, mining, and refining industries—are heavily reliant on oil and gas.
In the bulk chemicals industry, oil and gas are the primary feedstocks for chemical production. Meanwhile, the refining industry uses large amounts of process heating and steam energy from the direct combustion of fossil fuels.
While electrifying industrial processes can be difficult, using technologies like electric arc furnaces, electric boilers, and integrating renewable energy can advance industrial electrification while reducing emissions.
Transportation Sector
The transportation sector has by far the most room for electrification, with 99.8% of its energy consumption being non-electric.
The obvious reason behind this are gasoline-powered vehicles, which are prevalent in all forms of transport. In fact, motor gasoline usage for light-duty vehicles alone accounts for 51% of energy consumption in this sector.
While the electrification of transportation is underway with electric vehicles (EVs), the share of electricity in the sector’s energy use (0.2%) highlights the room for growth through widespread EV adoption.
How Electrification Impacts Decarbonization
Electrification is a crucial building block for economy-wide decarbonization.
Replacing fossil-fuel powered systems with electric alternatives opens up the possibility of powering these systems with low-carbon electricity sources like renewables and nuclear power.
Ultimately, for all sectors, electrification serves as a tool to leverage advancements in clean electricity and renewable technologies. Therefore, combined with a decarbonized power sector, increasing the extent of electrification can enable deep reductions in greenhouse gas emissions.
Road to Decarbonization: The United States Electricity Mix
This was originally posted on August 31, 2021, on Visual Capitalist.
The U.S. response to climate change and decarbonization is ramping up, and putting a focus on the country’s electricity mix.
As pressure has increased for near-term and immediate action after the UN’s latest IPCC report on climate change, major economies are starting to make bolder pledges. For the United States, that includes a carbon pollution-free utilities sector by 2035.
But with 50 states and even more territories—each with different energy sources readily available and utilized—some parts of the U.S. are a lot closer to carbon-free electricity than others.
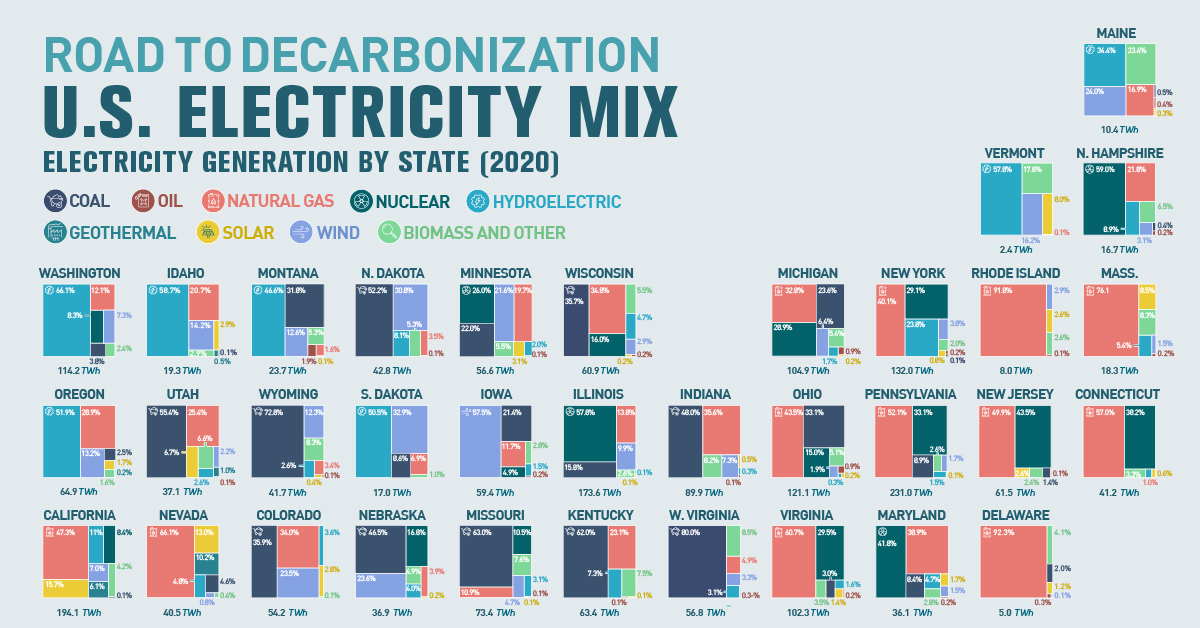
How does each state’s electricity mix compare? This infographic from the National Public Utilities Council highlights the energy sources used for electricity in U.S. states during 2020, using data from the U.S. Energy Information Administration.
The U.S. Electricity Generation Mix By State
How does the United States generate electricity currently?
Over the course of 2020, the U.S. generated 4,009 TWh of electricity, with the majority coming from fossil fuels. Natural gas (40.3%) was the biggest source of electricity for the country, accounting for more than nuclear (19.7%) and coal (17.3%) combined.
Including nuclear energy, non-fossil fuels made up 41.9% of U.S. electricity generation in 2020. The biggest sources of renewable electricity in the U.S. were wind (8.4%) and hydro (7.3%).
But on a state-by-state breakdown, we can see just how different the electricity mix is across the country (rounded to the nearest percentage).
| State (Electricity Source 2020) | Coal | Gas | Oil | Nuclear | Hydro | Geothermal | Solar | Wind | Biomass and Other |
|---|---|---|---|---|---|---|---|---|---|
| Alabama | 16% | 40% | 0% | 32% | 9% | 0% | 0% | 0% | 3% |
| Alaska | 13% | 38% | 16% | 0% | 31% | 0% | 0% | 3% | 1% |
| Arizona | 13% | 46% | 0% | 29% | 6% | 0% | 6% | 1% | 0% |
| Arkansas | 29% | 32% | 0% | 29% | 8% | 0% | 1% | 0% | 2% |
| California | 0% | 47% | 0% | 8% | 11% | 6% | 16% | 7% | 4% |
| Colorado | 36% | 34% | 0% | 0% | 4% | 0% | 3% | 24% | 0% |
| Connecticut | 0% | 57% | 0% | 38% | 1% | 0% | 1% | 0% | 3% |
| D.C. | 0% | 65% | 0% | 0% | 0% | 0% | 9% | 0% | 26% |
| Delaware | 2% | 92% | 0% | 0% | 0% | 0% | 1% | 0% | 4% |
| Florida | 7% | 75% | 1% | 12% | 0% | 0% | 3% | 0% | 3% |
| Georgia | 12% | 49% | 0% | 28% | 4% | 0% | 3% | 0% | 5% |
| Hawaii | 11% | 0% | 66% | 0% | 1% | 2% | 6% | 6% | 7% |
| Idaho | 0% | 21% | 0% | 0% | 59% | 1% | 3% | 14% | 3% |
| Illinois | 16% | 14% | 0% | 58% | 0% | 0% | 0% | 10% | 3% |
| Indiana | 48% | 36% | 0% | 0% | 0% | 0% | 1% | 7% | 8% |
| Iowa | 21% | 12% | 0% | 5% | 2% | 0% | 0% | 58% | 3% |
| Kansas | 28% | 6% | 0% | 20% | 0% | 0% | 0% | 43% | 3% |
| Kentucky | 62% | 23% | 0% | 0% | 7% | 0% | 0% | 0% | 8% |
| Louisiana | 4% | 70% | 3% | 17% | 1% | 0% | 0% | 0% | 5% |
| Maine | 1% | 17% | 0% | 0% | 34% | 0% | 0% | 24% | 23% |
| Maryland | 8% | 39% | 0% | 42% | 5% | 0% | 2% | 2% | 3% |
| Massachusetts | 0% | 76% | 0% | 0% | 5% | 0% | 9% | 2% | 8% |
| Michigan | 24% | 33% | 1% | 29% | 2% | 0% | 0% | 6% | 5% |
| Minnesota | 22% | 20% | 0% | 26% | 2% | 0% | 3% | 22% | 6% |
| Mississippi | 6% | 80% | 0% | 10% | 0% | 0% | 1% | 0% | 3% |
| Missouri | 63% | 11% | 0% | 11% | 3% | 0% | 0% | 5% | 8% |
| Montana | 32% | 2% | 2% | 0% | 47% | 0% | 0% | 13% | 5% |
| Nebraska | 47% | 4% | 0% | 17% | 4% | 0% | 0% | 24% | 5% |
| Nevada | 5% | 66% | 0% | 0% | 5% | 10% | 13% | 1% | 0% |
| New Hampshire | 0% | 22% | 0% | 59% | 9% | 0% | 0% | 3% | 7% |
| New Jersey | 1% | 50% | 0% | 44% | 0% | 0% | 3% | 0% | 2% |
| New Mexico | 34% | 36% | 1% | 0% | 1% | 0% | 5% | 21% | 3% |
| New York | 0% | 40% | 0% | 29% | 24% | 0% | 1% | 4% | 2% |
| North Carolina | 15% | 34% | 0% | 34% | 5% | 0% | 7% | 0% | 4% |
| North Dakota | 52% | 4% | 0% | 0% | 8% | 0% | 0% | 31% | 5% |
| Ohio | 33% | 44% | 1% | 15% | 0% | 0% | 0% | 2% | 5% |
| Oklahoma | 6% | 52% | 0% | 0% | 5% | 0% | 0% | 35% | 1% |
| Oregon | 3% | 29% | 0% | 0% | 52% | 0% | 2% | 13% | 2% |
| Pennsylvania | 9% | 52% | 0% | 33% | 2% | 0% | 0% | 2% | 3% |
| Rhode Island | 0% | 92% | 0% | 0% | 0% | 0% | 3% | 3% | 3% |
| South Carolina | 11% | 25% | 0% | 56% | 3% | 0% | 2% | 0% | 3% |
| South Dakota | 9% | 7% | 0% | 0% | 51% | 0% | 0% | 33% | 1% |
| Tennessee | 17% | 20% | 0% | 47% | 13% | 0% | 0% | 0% | 2% |
| Texas | 15% | 52% | 0% | 9% | 0% | 0% | 2% | 20% | 3% |
| Utah | 55% | 25% | 0% | 0% | 3% | 1% | 7% | 2% | 7% |
| Vermont | 0% | 0% | 0% | 0% | 58% | 0% | 8% | 16% | 18% |
| Virginia | 3% | 61% | 0% | 30% | 2% | 0% | 1% | 0% | 4% |
| Washington | 4% | 12% | 0% | 8% | 66% | 0% | 0% | 7% | 2% |
| West Virginia | 80% | 5% | 0% | 0% | 3% | 0% | 0% | 3% | 9% |
| Wisconsin | 36% | 35% | 0% | 16% | 5% | 0% | 0% | 3% | 6% |
| Wyoming | 73% | 3% | 0% | 0% | 3% | 0% | 0% | 12% | 8% |
At a glance, regional availability of a fuel source and historical use is clear.
For example, coal is the most-used electricity source in West Virginia, Kentucky, and Wyoming, historical coal rich regions and economies.
On the flip side, the Pacific Northwest and New England generated the most hydroelectricity, and the biggest producers of wind energy were all located in the Great Plains. Even the biggest percentage producers of solar and geothermal energy, California and Nevada, have plenty of access to sunlight and geothermal activity.
The Changing Electricity Landscape
But for the U.S. to reach its ambitious carbon-free goal by 2035, the biggest impact will need to come from the biggest electricity producers.
That title currently goes to Texas, which generated 12% of total U.S. electricity in 2020. Despite being the most populous state, California generated less than half Texas’ output, and less than both Florida and Pennsylvania.
| State | Electricity Generated 2020 (TWh) |
|---|---|
| Texas | 475.5 |
| Florida | 249.7 |
| Pennsylvania | 231.0 |
| California | 194.1 |
| Illinois | 173.6 |
| Alabama | 135.9 |
| New York | 132.0 |
| North Carolina | 124.0 |
| Ohio | 121.1 |
| Georgia | 119.3 |
| Washington | 114.2 |
| Arizona | 109.6 |
| Michigan | 104.9 |
| Virginia | 102.3 |
| Louisiana | 102.0 |
| South Carolina | 98.2 |
| Indiana | 89.9 |
| Oklahoma | 83.6 |
| Tennessee | 77.5 |
| Missouri | 73.4 |
| Mississippi | 65.8 |
| Oregon | 64.9 |
| Kentucky | 63.4 |
| New Jersey | 61.5 |
| Wisconsin | 61.0 |
| Iowa | 59.4 |
| West Virginia | 56.8 |
| Minnesota | 56.6 |
| Kansas | 54.3 |
| Colorado | 54.2 |
| Arkansas | 52.9 |
| North Dakota | 42.8 |
| Wyoming | 41.7 |
| Connecticut | 41.2 |
| Nevada | 40.5 |
| Utah | 37.1 |
| Nebraska | 36.9 |
| Maryland | 36.1 |
| New Mexico | 34.4 |
| Montana | 23.7 |
| Idaho | 19.3 |
| Massachusetts | 18.3 |
| South Dakota | 17.0 |
| New Hampshire | 16.7 |
| Maine | 10.4 |
| Hawaii | 9.3 |
| Rhode Island | 8.0 |
| Alaska | 5.9 |
| Delaware | 5.0 |
| Vermont | 2.4 |
| D.C. | 0.2 |
So although it’s positive that many states in the Pacific Northwest and New England have more plentiful non-fossil fuel electricity, their overall impact on the total U.S. picture is lessened.
Still, more and more states (and countries) are increasing their efforts and ambitions to decarbonize, and that progress makes it easier and more affordable over time. States that might struggle to attain carbon-free electricity, or where costs are too high, face less hurdles as technology improves and subsidies increase.
And with most major U.S. based utilities focusing on improving their ESG reporting and keeping up with decarbonization pledges of their own, the total electricity mix is expected to shift rapidly over the next decade.
National Public Utilities Council is the go-to resource for all things decarbonization in the utilities industry. Learn more.

-

 Energy Shift9 months ago
Ranked: The Cheapest Sources of Electricity in the U.S.
-

 Energy Shift1 year ago
Animated: 70 Years of U.S. Electricity Generation by Source
-

 Clean Energy1 year ago
Breaking Down Clean Energy Funding in the Inflation Reduction Act
-

 Emissions1 year ago
Visualizing Global Per Capita CO2 Emissions
-

 Clean Energy1 year ago
The 30 Largest U.S. Hydropower Plants
-

 Decarbonization1 year ago
The U.S. Utilities Decarbonization Index
-

 Clean Energy7 months ago
Breaking Down the $110 Trillion Cost of the Clean Energy Transition
-
 Climate1 year ago
Visualizing the State of Climate Change