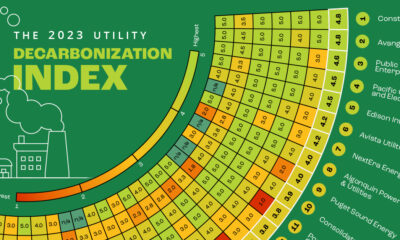

Here is a preview of our 2023 Utility Decarbonization Index, which tracks the decarbonization progress of the largest investor-owned utilities in America.
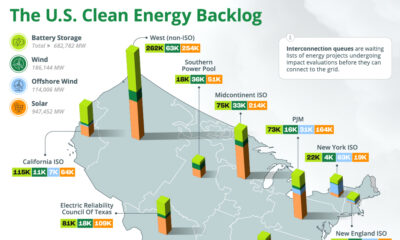

The U.S. has almost 2 million megawatts of clean energy capacity on hold in interconnection queues, seeking connection to the grid.
This infographic tracks the extent of electrification in the residential, commercial, industrial, and transportation sectors.
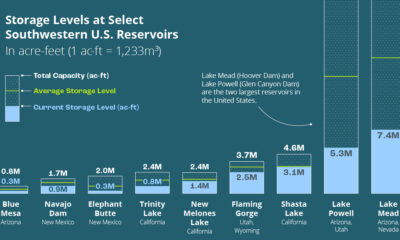

This infographic explores how droughts are affecting U.S. hydroelectric generation and the future of hydropower.
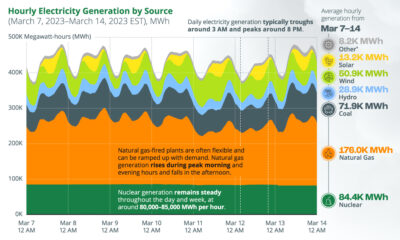

This chart tracks U.S. hourly electricity generation over one week, with various sources producing electricity at different times of the day.


In this animated chart, we explore the past 70 years of U.S. electricity generation by source.
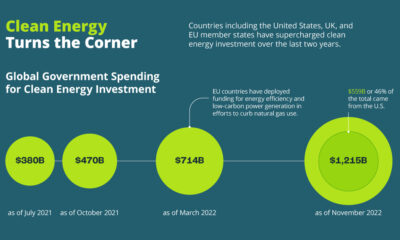

See how the energy crisis of 2022 accelerated the growth of clean energy.


This graphic breaks down the $392.5 billion in clean energy funding in the Inflation Reduction Act of 2022.
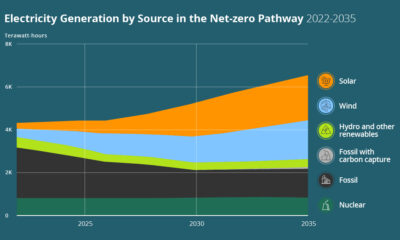

How can the U.S. achieve a 100% clean power sector? See the three key pillars of a decarbonized power sector in this infographic.


Hydropower accounts for one-third of U.S. renewable power generation. Here are the 30 largest U.S. hydropower plants.
