Energy Shift
Animated: 70 Years of U.S. Electricity Generation by Source
The following content is sponsored by the National Public Utilities Council
Animated: 70 Years of U.S. Electricity Generation by Source
Electricity generation in the U.S. has grown exponentially since 1950, going from 2.96 billion kilowatt-hours (kWh) in 1949 to 4.11 trillion kWh in 2021.
With the growth in electricity generation, the U.S. electricity mix has also evolved, especially as clean electricity sources such as nuclear, wind, and solar power grew in use.
In the animated chart by the National Public Utilities Council above, we explore the past 70 years of U.S. electricity generation, following along with the country’s dynamic electricity mix over the decades.
Trends in U.S. Power Generation Since 1950
The U.S. generated 1,200% more electricity in 2021 compared to 1950.
Here’s how the share of each source in the electricity mix changed over that period.
| Year | Coal | Natural Gas | Solar | Wind | Hydro | Nuclear | Other |
|---|---|---|---|---|---|---|---|
| 1950 | 46% | 13% | 0% | 0% | 30% | 0% | 10% |
| 2021 | 22% | 38% | 3% | 9% | 6% | 19% | 3% |
While coal and hydropower led as the largest sources of electricity in the 1950s, the growth in U.S. electricity demand is met primarily by natural gas today, followed by coal, nuclear, and wind power.
Despite coal’s heavy share in the U.S. electricity mix since 1949, its use has declined in recent years, peaking in 2007 in terms of total electricity generated.
With the low cost of natural gas and the advancement of decarbonization efforts, 80+ coal plants have retired or are set to retire in the next three decades in the United States. Despite this, coal remains the largest contributor to power sector emissions, accounting for 58% in 2021.
Besides the rise and fall of coal use, the animation highlights other interesting trends in the country’s power generation over the last 70 years, including:
- Nuclear energy slowly starts contributing to the electricity mix in 1957 as the Shippingport Atomic Power Station comes on in Pennsylvania. By 2020, nuclear power accounts for nearly 20% of total electricity generation.
- Solar and wind power start contributing to the mix in 1983-84, with wind accelerating faster than solar power to account for 1% of total electricity generated by 2008 and 9% by 2021.
- Electricity sourced from natural gas surpasses that from coal in 2016 and continues to absorb most of the decline in coal use through the present day.
- Hydropower’s share in the electricity mix remains stable since 2000, making up 5 to 6% of total electricity generated each year.
The Road to Net-zero
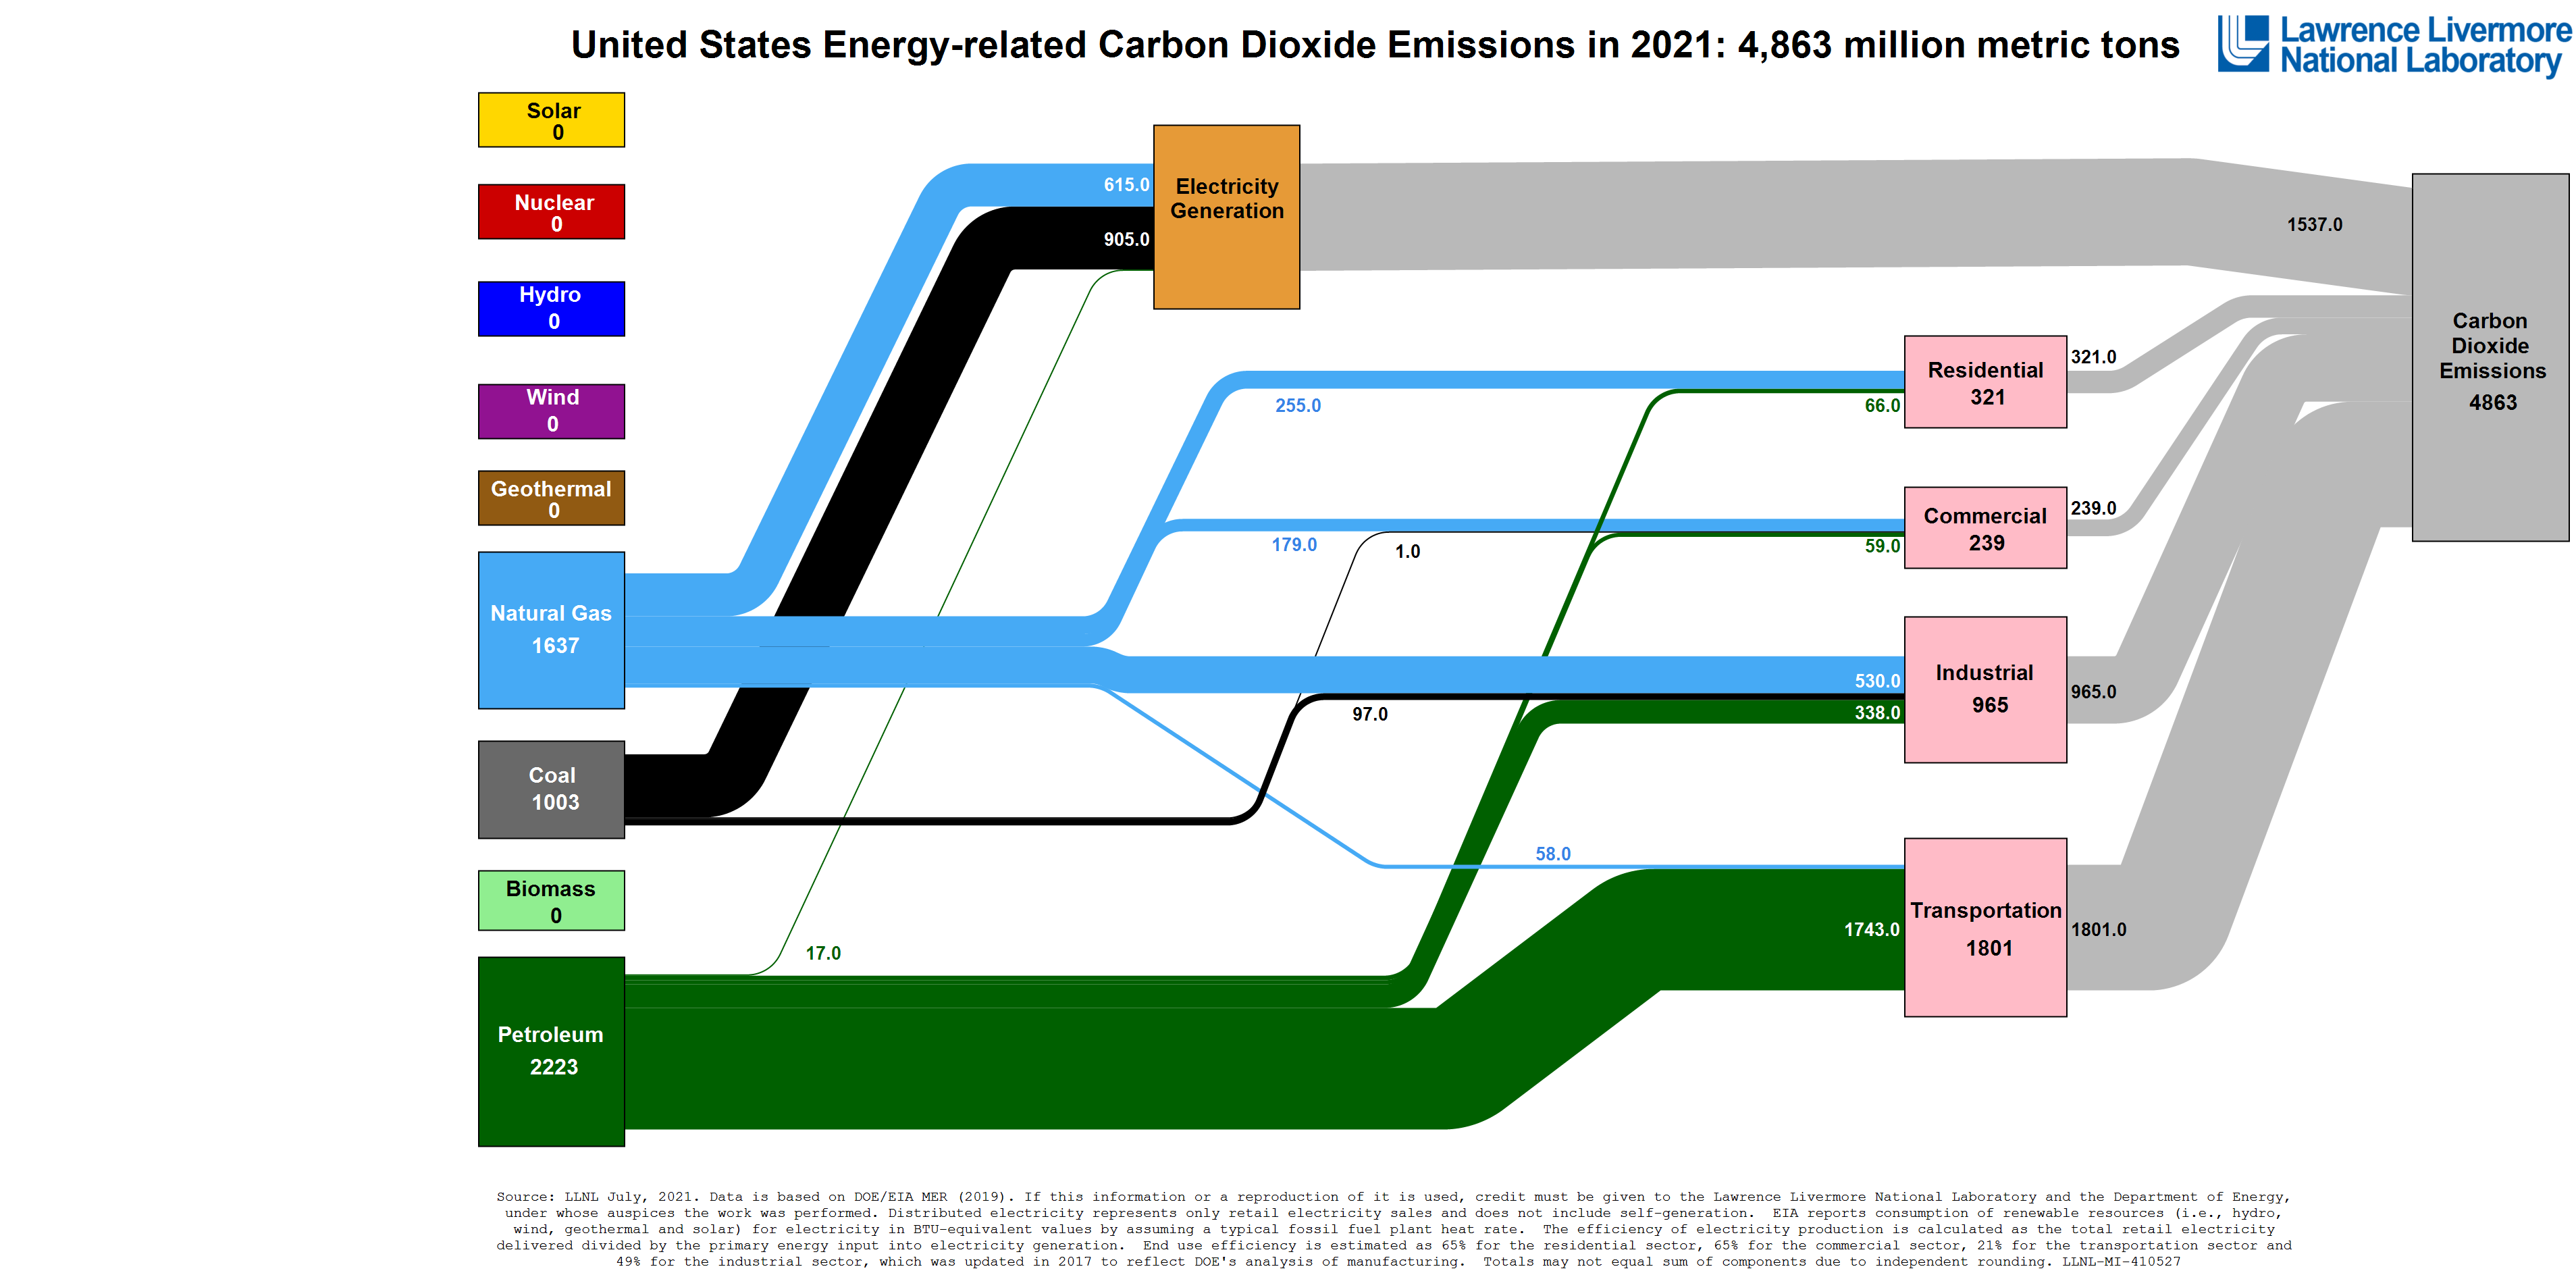
While the decline in coal use for electricity aids in lowering emissions, the U.S. power sector has a long way to go in decarbonizing. In 2021, the use of fossil fuels for power generation contributed 1,537 million tonnes of carbon dioxide emissions in the country.
Therefore, accelerating the deployment of carbon-free energy sources is critical for the road to a decarbonized power sector.
The chart below shows how U.S. electricity generation needs to change to achieve net-zero emissions by 2050.
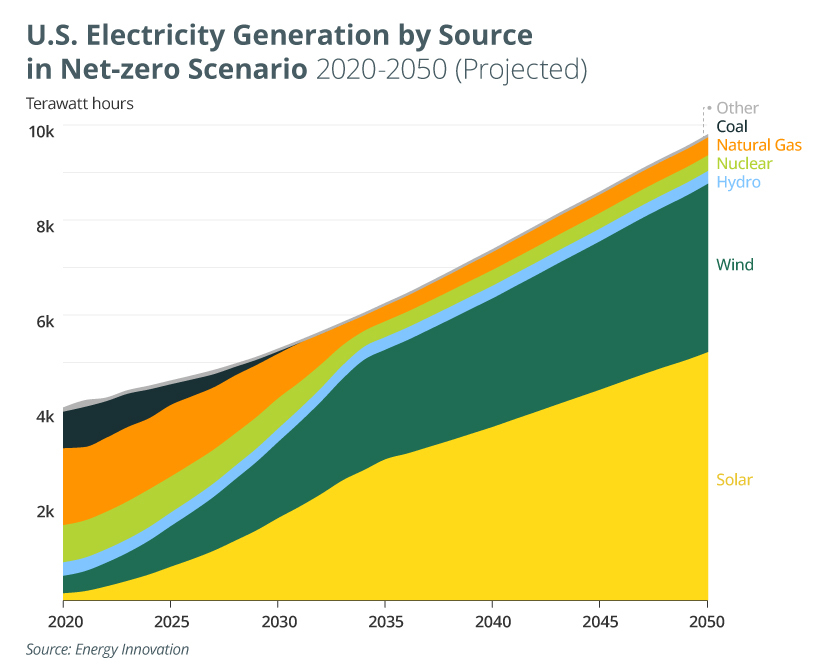
In the net-zero scenario, Energy Innovation’s policy simulator counts on a complete phase-out of coal-fired electricity by 2034, along with a 36-fold increase in solar power generation and a 10-fold increase in wind power generation by 2050 (compared to 2020 levels.)
The rapid transition from fossil fuels to clean-energy sources, coupled with adequate transmission expansion and investment in battery storage, is integral for a carbon-free power sector. With prompt action, the next 30 years of U.S. electricity generation has the power to look a lot like the projected graph above, giving way to lower emissions for all other sectors that use electricity.
Energy Shift
All Commercially Available Long Duration Energy Storage Technologies, in One Chart
In this chart, we break down the parameters of LDES technologies that have commercial or pre-commercial readiness.
All Commercially Available Long Duration Energy Storage Technologies, in One Chart
Long duration energy storage (LDES) technologies can store electricity for 10+ hours, complementing intermittent renewables, boosting grid resiliency, and reducing fossil fuel dependency.
Created in partnership with the National Public Utilities Council, this chart lists the characteristics of LDES technologies that have commercial or pre-commercial readiness, using data from the LDES Council’s Net-Zero Power report and 2023 deployment update.
The Four Primary Types of LDES
Before getting into the details, let’s cover the four primary types of LDES.
- Mechanical: Stores potential energy (by tension or position)
- Thermal: Stores energy as heat
- Chemical: Stores energy found within chemical bonds
- Electrochemical (batteries): Stores energy of chemical reactions, where electrical energy is converted to chemical energy and vice versa
Currently, mechanical storage systems are the most common around the world. Aboveground pumped hydropower, for instance, currently accounts for 96% of all utility-scale energy storage in the United States.
How Do LDES Technologies Measure Up?
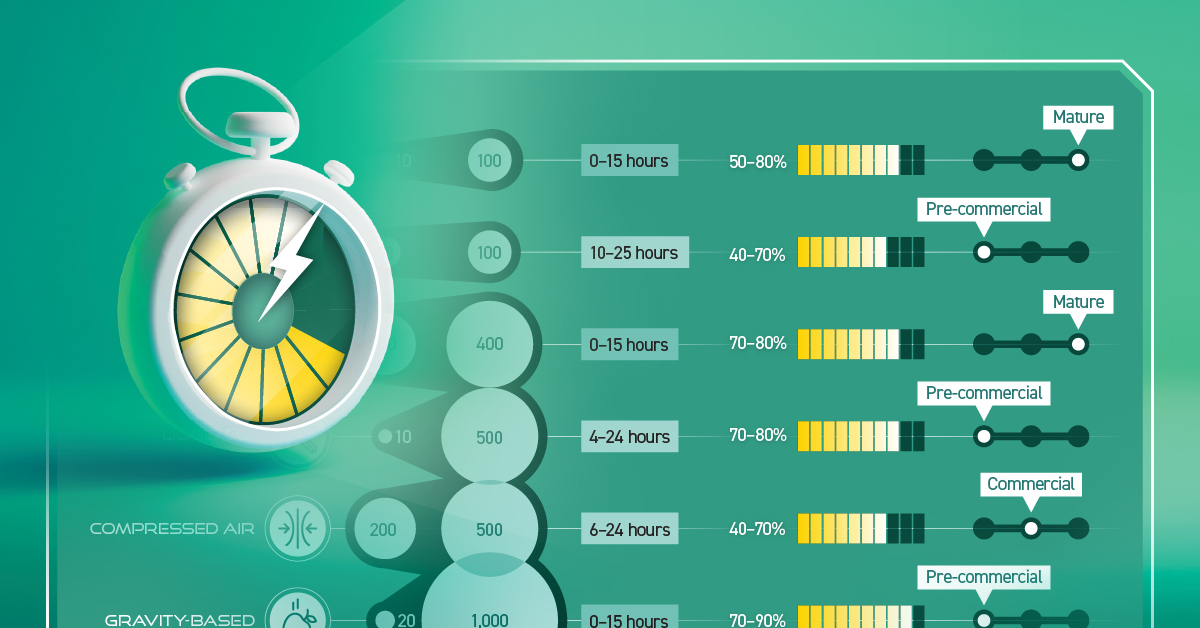
Below, we list the storage capacity, storage duration, and average round-trip efficiency (RTE) of LDES technologies that have commercial or pre-commercial readiness on a global scale.
For context, RTE measures the effectiveness of a storage system by measuring the ratio of energy output to energy input during a full charge-discharge cycle. Or briefly, the higher the RTE, the lower the losses and therefore higher the efficiency.
| Form of Energy Storage | LDES Technology | Storage Capacity (MW) | Nominal Duration (Hours) | Average Round-Trip Efficiency |
|---|---|---|---|---|
| Mechanical | Underground pumped hydro | 10–100 | 0–15 | 50–80% |
| Mechanical | Liquid air | 50–100 | 10–25 | 40–70% |
| Mechanical | Aboveground pumped hydro | 200–400 | 0–15 | 70–80% |
| Mechanical | Liquid CO2 | 10–500 | 4–24 | 70–80% |
| Mechanical | Compressed air | 200–500 | 6–24 | 40–70% |
| Mechanical | Gravity-based | 20–1,000 | 0–15 | 70–90% |
| Thermal | Sensible heat | 10–500 | 200 | 55–90% |
| Chemical | Power-to-gas-to-power | 10–100 | 500–1,000 | 40–70% |
| Electrochemical | Aqueous electrolyte flow battery | 10–100 | 25–100 | 50–80% |
| Electrochemical | Metal anode battery | 10–100 | 50–200 | 40–70% |
| Electrochemical | Hybrid flow battery (with liquid electrolyte and metal anode) | >100 | 8–50 | 55–75% |
The table above shows that a mechanical, gravity-based LDES system can provide the highest storage capacity while presenting an impressive 70–90% average RTE.
On the other hand, a chemical power-to-gas-to-power system, which typically converts electricity to hydrogen gas and back to electricity, provides the highest storage duration of up to 1,000 hours.
With that said, there are different storage needs and siting considerations across electrical grids. Given the diverse range of options available, suitable solutions can be found to complement renewables and aid decarbonization.
Learn how the National Public Utilities Council is working toward the future of sustainable electricity.
Energy Shift
Visualized: The Evolution of Energy Employment (2022–2030P)
This graphic shows the projected evolution of global energy employment between 2022 and 2030 using data by the International Energy Agency.

The Evolution of Energy Employment (2022–2030P)
According to the International Energy Agency (IEA), just over half of the 67 million people employed in the global energy industry in 2022 worked in the clean energy sector: 35 million vs. 32 million in fossil fuels. And with the clean energy transition picking up pace, that gap is set to widen.
In this graphic created in partnership with the National Public Utilities Council, we explore how global energy employment could change by 2030 in a current policy scenario, using projections from the IEA.
The Rise in Clean Energy Employment
The IEA’s current policy scenario is a conservative projection for progress in line with the present trajectory of our energy system. It doesn’t assume that nations will reach their announced goals or that net zero will be achieved by 2050.
Even within this conservative scenario, the global energy sector is projected to have a net gain of 5.7 million jobs by 2030. Except for the 300,000 jobs added in the oil and gas supply industry, these jobs are all in clean energy.
In a more ambitious scenario, aligned with achieving net zero by 2050, the net gain in jobs is projected to nearly triple to 17 million.
| Changes in global energy employment 2022–2030P, millions of jobs | Current policies scenario | Net-zero emissions 2050 scenario |
|---|---|---|
| Coal supply | -1.4 | -2.8 |
| Internal combustion engine vehicles | -1.1 | -6.2 |
| Unabated fossil fuel electricity | -0.2 | -1.2 |
| Critical minerals | +0.2 | +0.7 |
| Oil and gas supply | +0.3 | -2.5 |
| Low-emissions fuels | +0.4 | +3.2 |
| End-use efficiency | +1.2 | +3.2 |
| Energy grids and storage | +1.4 | +3.8 |
| Low-emission electricity | +1.7 | +11 |
| Electric vehicles and batteries | +3.2 | +7.7 |
| Net job creation | +5.7 | +16.9 |
In both scenarios, the global energy industry is poised to create millions of new jobs in the coming years, with the job gains in the clean energy sector significantly outweighing the job losses in the fossil fuel industry.
A People-Centred Transition
With projected growth of this magnitude, the IEA emphasizes that policymakers and industry must support employee transitions from fossil fuels and address skill gaps in emerging industries through education and training.
According to the World Energy Employment report, continued efforts in these areas are crucial to prevent labor shortages and avoid delays in the clean energy transition.
Learn how the National Public Utilities Council is working toward the future of sustainable electricity.

-

 Electrification1 year ago
Visualized: How the Power Grid Works
-

 Energy Shift9 months ago
Ranked: The Cheapest Sources of Electricity in the U.S.
-

 Clean Energy1 year ago
Breaking Down Clean Energy Funding in the Inflation Reduction Act
-

 Emissions1 year ago
Visualizing Global Per Capita CO2 Emissions
-

 Clean Energy1 year ago
The 30 Largest U.S. Hydropower Plants
-

 Decarbonization1 year ago
The U.S. Utilities Decarbonization Index
-

 Clean Energy7 months ago
Breaking Down the $110 Trillion Cost of the Clean Energy Transition
-
 Climate1 year ago
Visualizing the State of Climate Change