Decarbonization
The 3 Building Blocks for a Decarbonized Power Sector


The following content is sponsored by the National Public Utilities Council
The 3 Building Blocks for a Decarbonized Power Sector
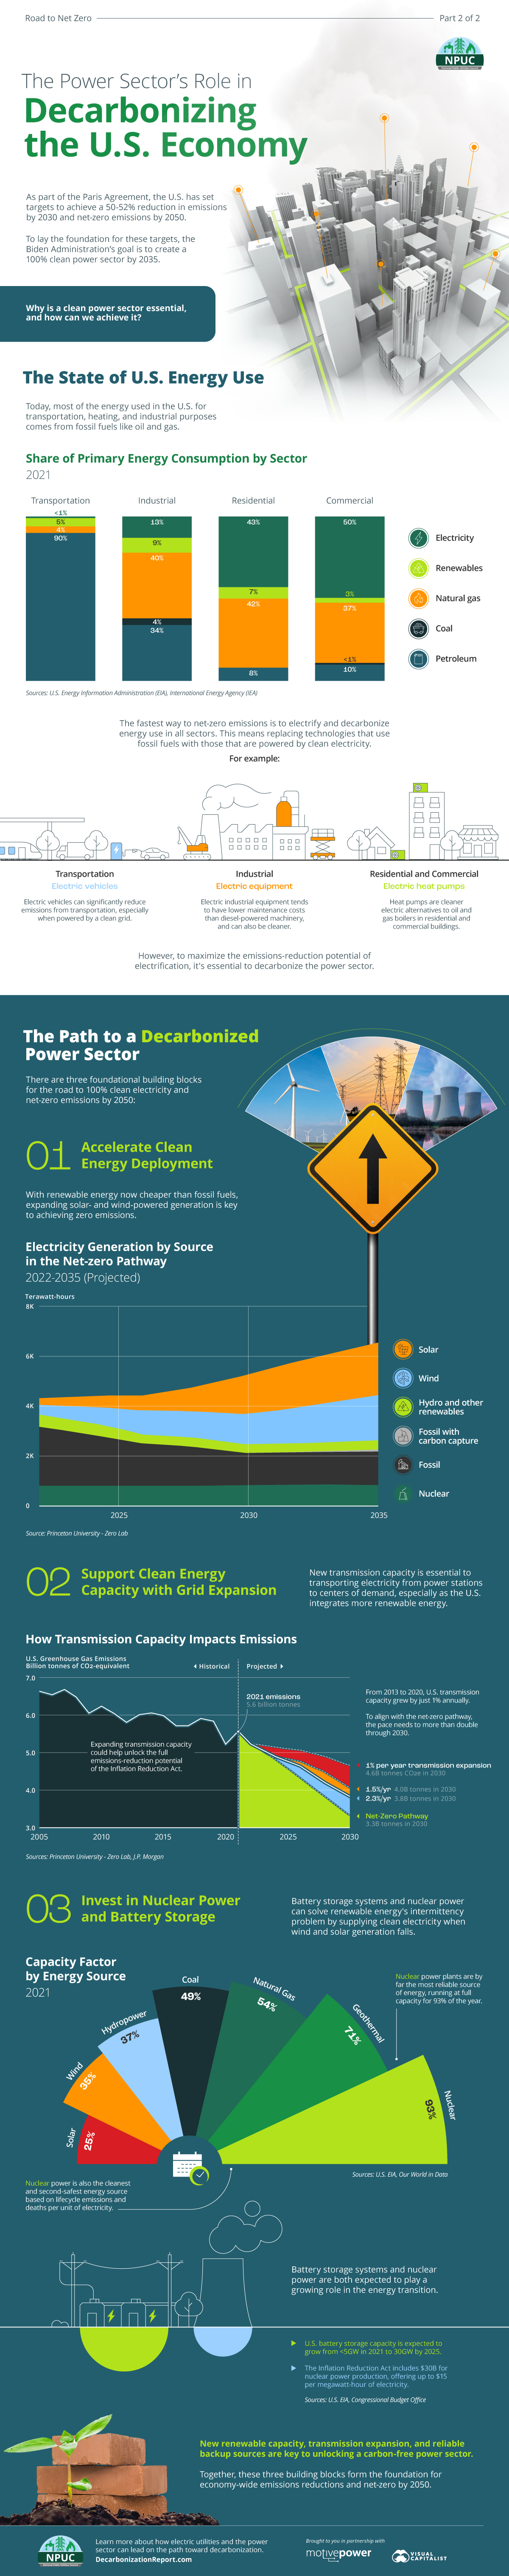
As part of the Paris Agreement, the U.S. has set goals to achieve a 50-52% reduction in emissions by 2030 and net-zero emissions by 2050.
To lay the foundation for these targets, the Biden Administration’s goal is to create a 100% clean power sector by 2035.
This infographic from the National Public Utilities Council shows why a clean power sector is essential for net-zero emissions and highlights the three building blocks needed to achieve it. This is part 2 of the Road to Net Zero series of infographics.
The State of U.S. Energy Use
Today, fossil fuels like oil and gas provide most of the energy used in the U.S. for transportation, heating, and industrial purposes.
For example, due to the prevalence of gasoline vehicles, petroleum accounts for 90% of the transportation sector’s energy consumption, with electricity making up less than 1% of the total.
Similarly, around 80% of the industrial sector’s energy needs are met with natural gas and petroleum. Meanwhile, the residential and commercial sectors use large amounts of natural gas for their space heating needs, along with electricity for other appliances.
With fossil fuels widespread in the U.S. energy mix, the fastest path to net-zero emissions is to electrify and decarbonize energy use in all sectors. This involves replacing technologies that use fossil fuels with those powered by electricity and a clean grid.
For instance, electric vehicles could transform the transportation sector’s energy consumption and reduce emissions. Additionally, electric heat pumps could replace oil and gas boilers in residential and commercial buildings.
However, for electrification to be effective in reducing emissions, decarbonizing the power sector and generating clean electricity is essential.
The Path to a Decarbonized Power Sector
Decarbonization calls for a transformation of the power sector, from one where fossil fuels generate 60% of total electricity to one dominated by clean energy and backed by an upgraded grid.
There are three foundational building blocks for the road to 100% clean electricity:
#1: Accelerate Clean Energy Deployment
With renewable energy now cheaper than fossil fuels, expanding solar- and wind-powered generation is key to replacing fossil fuels and reaching zero emissions.
According to Princeton University, for net-zero emissions by 2050, the U.S. needs to add more than 50 gigawatts of solar capacity annually from 2022 to 2035. That is significantly higher than the 13 gigawatts installed in 2021.
#2: Support Clean Energy with Grid Expansion
With the U.S. power grid aging, new high-voltage transmission capacity is essential for transporting electricity from remote solar and wind farms to centers of demand.
From 2013 to 2020, U.S. transmission capacity grew by just 1% annually. To align with the net-zero pathway, the pace of expansion needs to more than double through 2030.
Here’s how transmission expansion could affect U.S. greenhouse gas (GHG) emissions, as modeled by Princeton:
| Transmission Expansion Rate | Projected GHG Emissions in 2030 | % Change in Emissions vs. 2021 |
|---|---|---|
| 1% per year | 4.6 billion tonnes | -18% |
| 1.5% per year | 4.0 billion tonnes | -29% |
| 2.3% per year | 3.8 billion tonnes | -32% |
Source: Princeton University – Zero Lab
With a 2.3% annual growth in transmission capacity, U.S. GHG emissions could achieve a 32% reduction from the 5.6 billion tonnes emitted in 2021.
#3: Invest in Nuclear Power and Battery Storage
The intermittent nature and low reliability of wind and solar power generation pose a challenge for the energy transition.
Battery storage systems and nuclear power can solve the intermittency problem by supplying clean electricity when wind and solar generation falls.
For example, storage systems can store excess solar power that is produced during sunny periods of the day, and supply it in the evening when solar generation dips. Meanwhile, nuclear power plants can supply electricity around the clock, acting as a clean baseload power source.
Towards a Carbon-free U.S. Economy
New renewable capacity, transmission expansion, and reliable backup sources are key to unlocking a carbon-free power sector.
Together, these three building blocks form the foundation for economy-wide emissions reduction and net-zero emissions by 2050.
Decarbonization
Unpacking Hydrogen’s Role in Decarbonizing the Electricity Sector
In this infographic, we discuss three ways hydrogen can support the decarbonization of the global electricity sector.
Hydrogen’s Role in Decarbonizing the Electricity Sector
Hydrogen constitutes 75% of the elemental mass in our universe.
According to the International Energy Agency (IEA), it could also play a pivotal role in global decarbonization efforts.
This infographic, created in partnership with the National Public Utilities Council, explores three ways this element could support the decarbonization of the global electricity sector.
Hydrogen 101
First, let’s get a few basics about hydrogen out of the way.
While abundant in nature, hydrogen is rarely found in its elemental state (H2) on Earth, meaning that it needs to be separated from other chemical compounds, such as water (H2O). Once extracted, however, it becomes a versatile and energy-dense fuel source, containing approximately three times the energy content of gasoline or natural gas.
There are several methods to extract hydrogen from compounds. Depending on the production method and energy source, the resulting hydrogen is often categorized by color to show its emission impact.
| Color | Hydrogen Production Method | Energy Source |
|---|---|---|
| Black | Gasification | Coal or Lignite |
| Gray | Steam Methane Reforming (SMR) | Natural Gas |
| Blue | SMR + Carbon Capture and Storage (CCS) | Natural Gas |
| Purple* | Electrolysis | Nuclear Energy |
| Green | Electrolysis | Renewable Energy |
*Purple hydrogen is also referred to as red or pink hydrogen.
Today, black, gray, and blue hydrogen are used in emission-heavy industries such as petroleum refining and ammonia production.
The technology and infrastructure for purple and green hydrogen, on the other hand, are still taking shape. As they progress, these emission-free sources of hydrogen are expected to play a pivotal role in decarbonizing many hard-to-abate sectors, including power.
Three Ways Green Hydrogen Can Help Decarbonize
Now that we’ve covered hydrogen basics, let’s dive into where emission-free hydrogen can fit in the race to decarbonize our global electricity system.
#1: Hydrogen and Natural Gas Blending
Hydrogen can be blended with natural gas in existing pipeline infrastructure for lower-emission power generation.
According to Jenbacher, a 20–30% hydrogen volume can lead to a 7–11% decrease in CO2 emissions, compared to natural gas on its own.
In 2022, U.S. electricity from natural gas generated 743 million metric tons in the United States. A 9% reduction in emissions through hydrogen blending lowers emissions by 67 million metric tons CO2, all without the need to build new infrastructure.
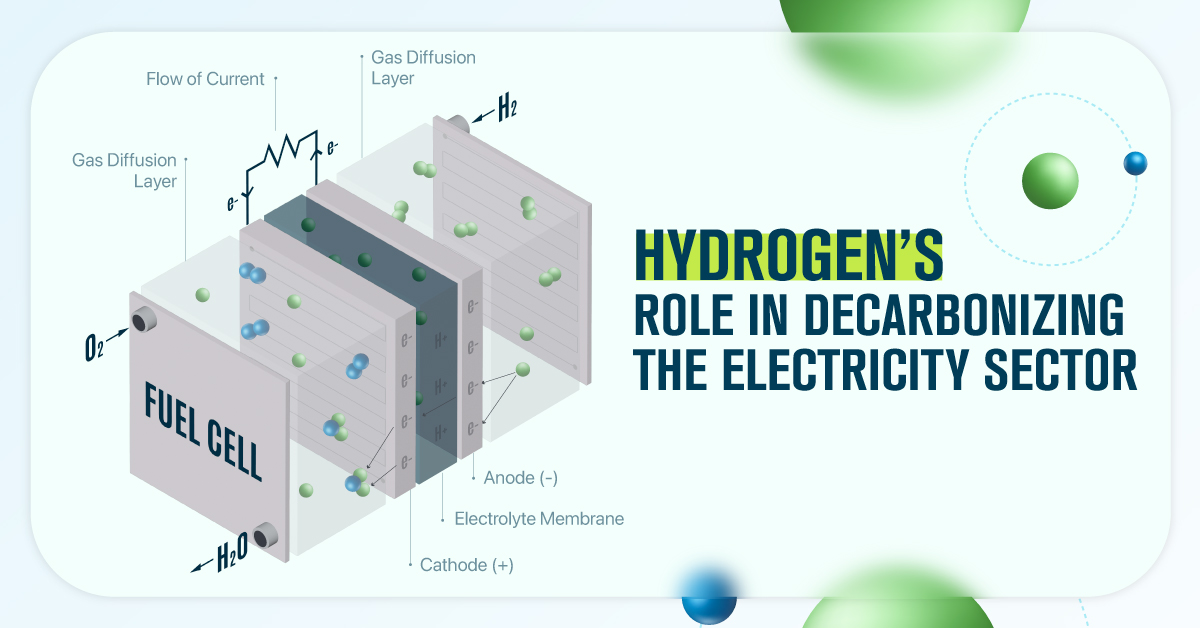
#2: Fuel Cells
A fuel cell generates electricity through an electrochemical reaction between hydrogen and oxygen, with water as the only byproduct.
By using green or pink hydrogen, fuel cells can provide 100% emission-free electricity that is also efficient, reliable, and dispatchable.
#3: Energy Storage
Energy storage plays a pivotal role in decarbonizing the power sector by balancing the intermittent nature of renewables.
While other technologies, such as lithium-ion batteries, can also provide energy storage, hydrogen has a greater potential to offer both large-scale and long-term storage, up to several months at a time.
As technology advances, the IEA predicts that global underground hydrogen capacity will grow by more than 200,000% in the next 30 years, reaching 1,200 TWh in 2050. That amount of energy can power 70,000 U.S. homes for an entire year, underscoring the untapped potential that lies within hydrogen.
Learn how the National Public Utilities Council is working towards the future of sustainable electricity.
Climate
Mapped: Global Temperature Rise by Country (2022-2100P)
In this set of three maps, we show the global temperature rise on a national level for 2022, 2050, and 2100 based on an analysis by Berkeley Earth.
Mapped: Global Temperature Rise by Country (2022-2100P)
Many scientific authorities, such as the Intergovernmental Panel on Climate Change (IPCC), often discuss the need to limit planetary warming to 2°C above pre-industrial levels.
But did you know that this warming will not be evenly distributed throughout the globe due to factors such as geography, weather patterns, ocean currents, and the influence of human activities?
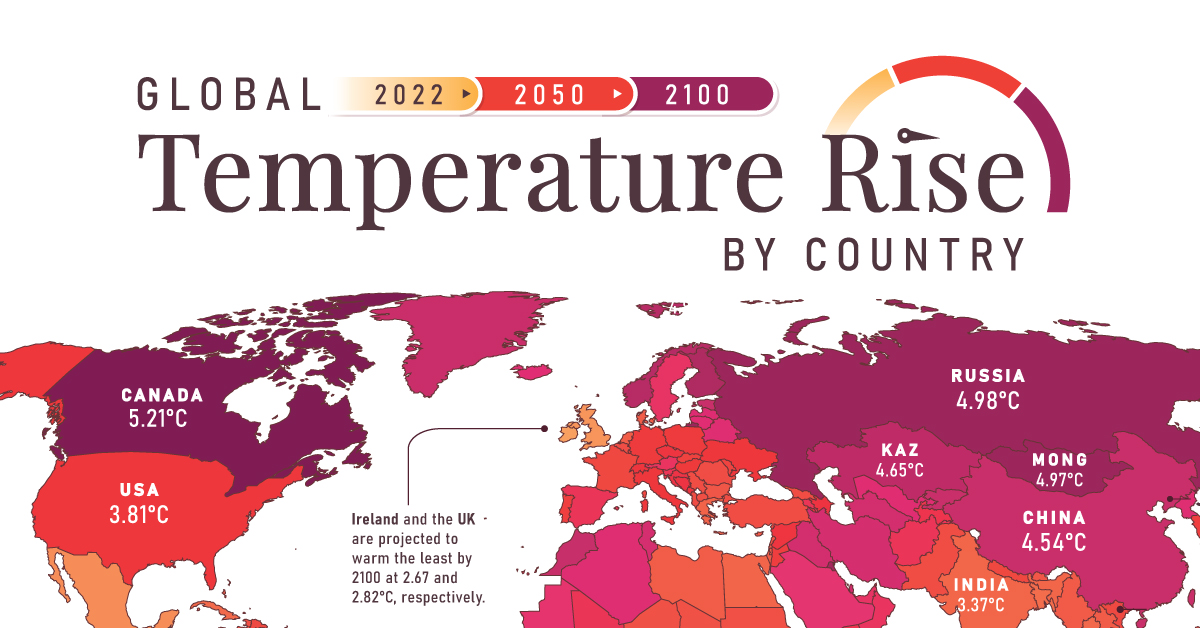
To discover the current and projected nuances of this uneven warming, these three maps created in partnership with the National Public Utilities Council visualize the global temperature rise by country, using new and updated data from Berkeley Earth.
Current State of Warming
The three maps above visualize warming relative to each country’s average 1850-1900 temperatures.
Looking at warming in 2022, we see that average national warming (i.e. warming excluding oceans) is already 1.81°C above those numbers, with Mongolia warming the most (2.54°C) and Bangladesh warming the least (1.1°C).
As the map depicts, warming is generally more accelerated in the Global North. One of the reasons for this is Arctic amplification.
Arctic amplification refers to the disproportionate heating experienced in the Arctic compared to the rest of the planet. This amplification is fueled by multiple feedback loops, including decreased albedo as ice cover diminishes, leading to further absorption of heat and exacerbating the warming effect.

Arctic amplification. Source: NASA
Aside from modern-day observations, the effects of Arctic amplification are also clearly seen in climate models, where accelerated warming in countries such as Russia and Canada is seen through 2100.
Projected Warming in 2050 and 2100
Moving over to the second and third maps in the slides above, we discover country-level 2050 and 2100 warming projections.
These projections are based on the IPCC’s “middle-of-the-road” scenario, titled Shared Socioeconomic Pathway (SSP) 2-4.5. Out of the various established pathways, this one is the closest to expected emissions under current policies.
2050 Projections
Under the SSP2-4.5 scenario, average national warming is projected to be 2.75°C above average 1850-1900 temperatures in 2050. This includes Mongolia, with the most substantial warming of 3.76°C, and New Zealand, with the mildest warming of 2.02°C.
To put those temperatures into context, here are the risks that would likely accompany them, according to the IPCC’s latest assessment report.
- Extreme weather events will be more frequent and intense, including heavy precipitation and related flooding and cyclones.
- Nearly all ecosystems will face high risks of biodiversity loss, including terrestrial, freshwater, coastal and marine ecosystems.
- Accelerated sea level rise will threaten coastal cities, leading to mass displacement.
Let’s now take a look at 2100 projections, which would have significantly higher levels of risk unless fast and extreme mitigation and adaptation measures are implemented in the upcoming decades.
2100 Projections
2100 projections under the SSP2-4.5 scenario depict an average national warming of 3.80°C.
More than 55 countries across the globe are projected to have warming above 4°C in comparison to their 1850-1900 averages, and nearly 100 above 3.5°C.
Here is what those levels of warming would likely mean, according to the IPCC.
- 3-39% of terrestrial species will face very high risks of extinction.
- Water scarcity will considerably affect cities, farms, and hydro plants, and about 10% of the world’s land area will experience rises in both exceptionally high and exceptionally low river flows.
- Droughts, floods, and heatwaves will pose substantial threats to global food production and accessibility, eroding food security and impacting nutritional stability on a significant scale.
Generally, warming at this level is expected to pose substantial catastrophic risks to humanity, necessitating swift and bold climate action.
Learn more about how electric utilities and the power sector can lead on the path toward decarbonization here.

-

 Electrification1 year ago
Visualized: How the Power Grid Works
-

 Energy Shift9 months ago
Ranked: The Cheapest Sources of Electricity in the U.S.
-

 Energy Shift1 year ago
Animated: 70 Years of U.S. Electricity Generation by Source
-

 Clean Energy1 year ago
Breaking Down Clean Energy Funding in the Inflation Reduction Act
-

 Emissions1 year ago
Visualizing Global Per Capita CO2 Emissions
-

 Clean Energy1 year ago
The 30 Largest U.S. Hydropower Plants
-

 Decarbonization1 year ago
The U.S. Utilities Decarbonization Index
-

 Clean Energy6 months ago
Breaking Down the $110 Trillion Cost of the Clean Energy Transition