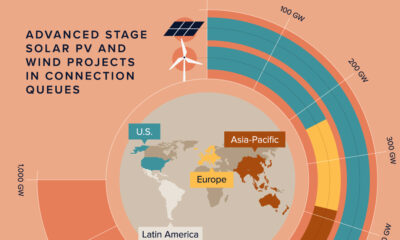

Streamlining processes, investing in infrastructure, and promoting local manufacturing can pave the way for wind and solar adoption.
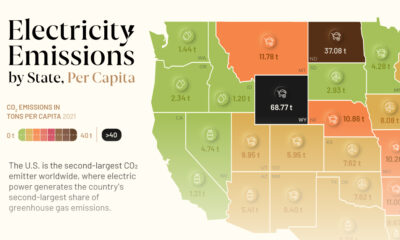

This graphic showcases electricity emissions by state, highlighting each state's largest source of power.
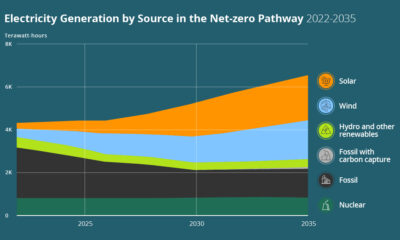

How can the U.S. achieve a 100% clean power sector? See the three key pillars of a decarbonized power sector in this infographic.


How does electricity get from the power plant to our homes? This infographic illustrates how the power grid works.
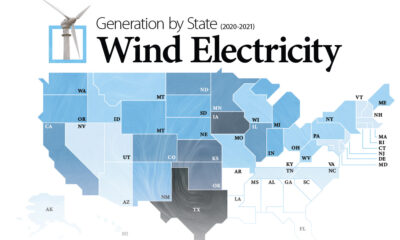

Mapping U.S. Wind Energy by State This was originally published on April 25, 2022, on Elements. Wind power is the most productive renewable energy source in...
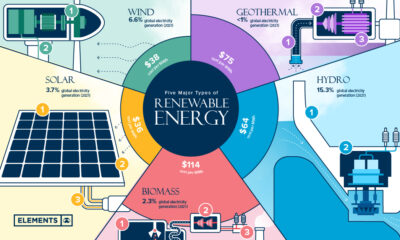

Renewable energy is the foundation of the ongoing energy transition. What are the key types of renewable energy, and how do they work?
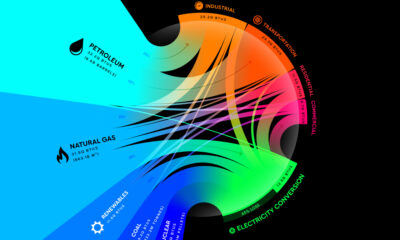

Breaking Down America’s Energy Consumption in 2020 This was originally published on July 6 2021, on Visual Capitalist. The United States relies on a complex mix...


