Energy Shift
Visualizing U.S. Greenhouse Gas Emissions by Sector
The following content is sponsored by National Public Utilities Council
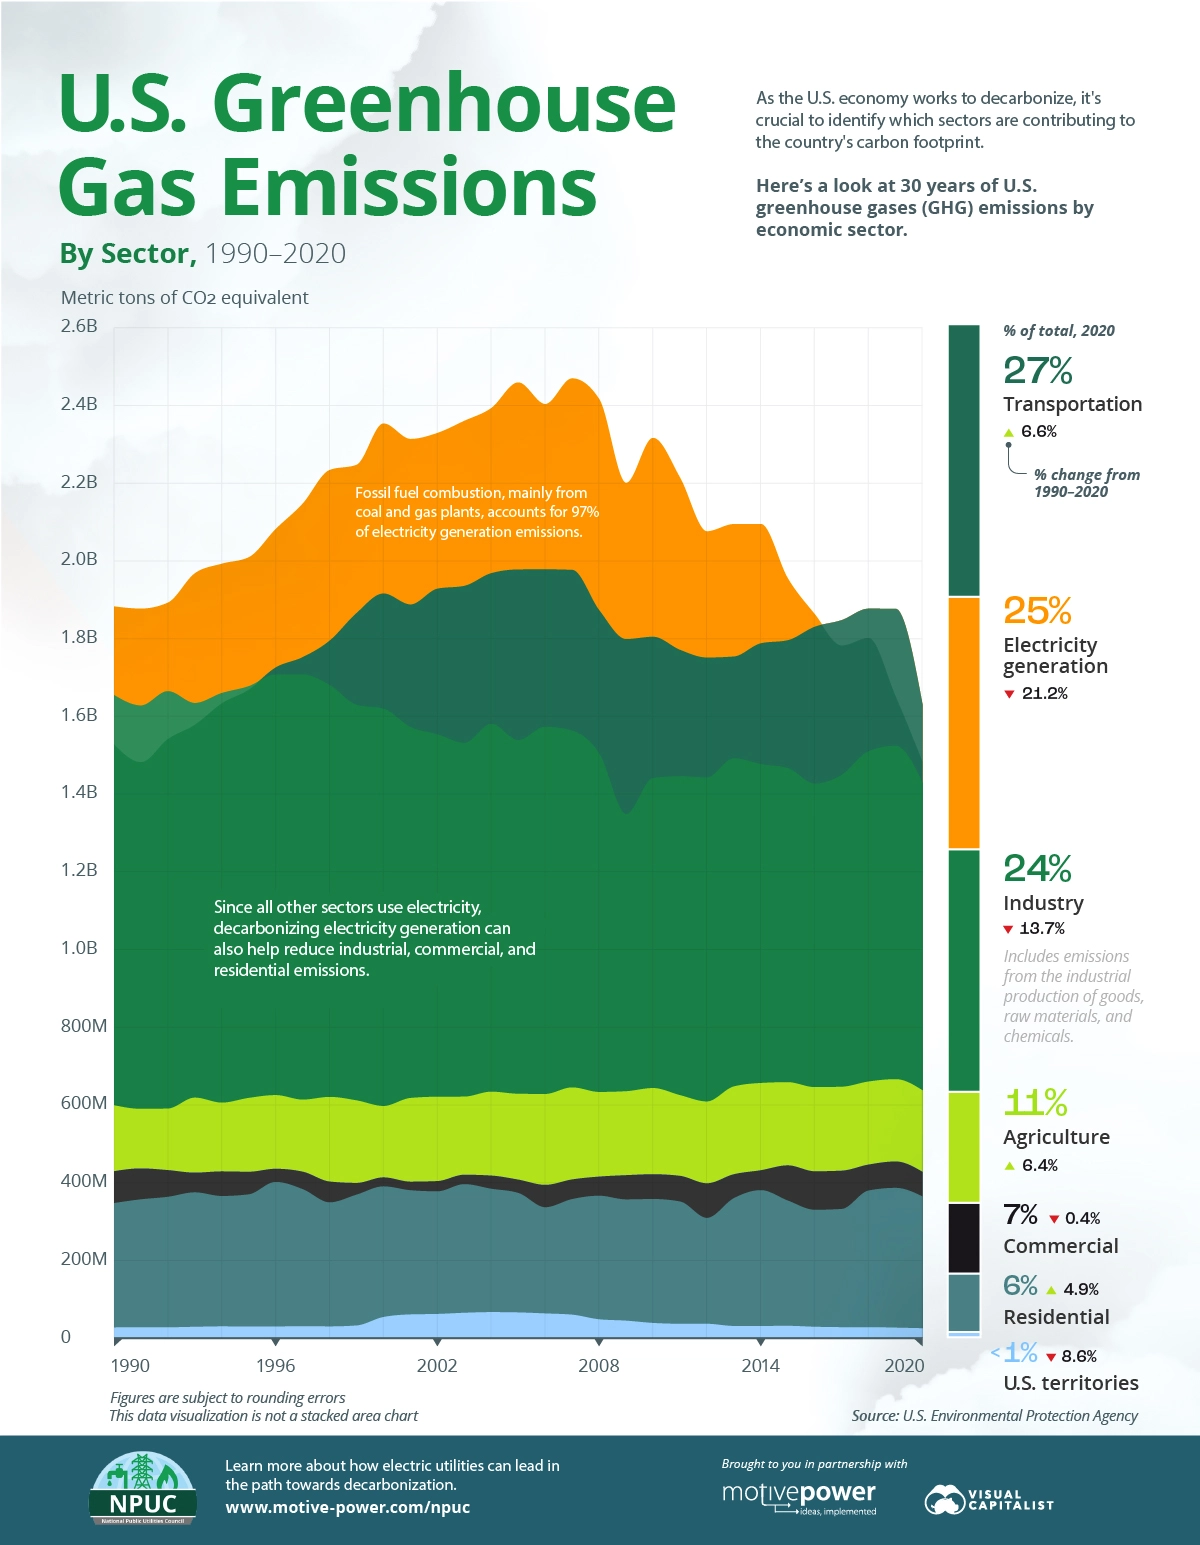
Visualizing U.S. Emissions by Sector
Decarbonization efforts in the U.S. are ramping up, and in 2020, greenhouse gas (GHG) emissions were lower than at any point during the previous 30 years.
However there’s still work to be done before various organizations, states, and nationwide targets are met. And when looking at GHG emissions by sector, the data suggests that some groups have more work cut out for them than others.
This graphic from the National Public Utilities Council provides the key data and trends on the total emissions by U.S. sector since 1990.
The Highest Emitting Sectors
Collectively, the U.S. emitted 5,981 million metric tons (MMT) of CO2-equivalent (CO2e) emissions in 2020, which rose 6.1% in 2021.
Here’s how the various sectors in the U.S. compare.
| Sector | 2020 GHG emissions, MMT CO2e | Percentage of Total |
|---|---|---|
| Transportation | 1,627.6 | 27% |
| Electricity generation | 1,482.6 | 25% |
| Industry | 1,426.2 | 24% |
| Agriculture | 635.1 | 11% |
| Commercial | 425.3 | 7% |
| Residential | 362.0 | 6% |
| U.S. territories | 23.0 | <1% |
The transportation sector ranks highest by emissions and has been notably impacted by the COVID-19 pandemic, which is still affecting travel and supply chains. This has led to whipsawing figures during the last two years.
For instance, in 2020, the transportation sector’s emissions fell 15%, the steepest fall of any sector. But the largest increase in emissions in 2021 also came from transportation, which is largely credited to the economic and tourism recovery last year.
Following transportation, electricity generation accounted for a quarter of U.S. GHG emissions in 2020, with fossil fuel combustion making up nearly 99% of the sector’s emissions. The other 1% includes waste incineration and other power generation technologies like renewables and nuclear power, which produce emissions during the initial stages of raw material extraction and construction.
Decarbonizing the Power Sector
The Biden Administration has set a goal to make the U.S. power grid run on 100% clean energy by 2035—a key factor in achieving the country’s goal of net zero emissions by 2050.
Industrial factories, commercial buildings, and homes all consume electricity to power their machinery and appliances. Therefore, the power sector can help reduce their carbon footprint by supplying more clean electricity, although this largely depends on the availability of infrastructure for transmission.
Here’s how sectors would look if their respective electricity end-use is taken into account
| Sector | Emissions by Sector % of Total |
|---|---|
| Agriculture | 11% |
| Transportation | 27% |
| Industry | 30% |
| Residential & Commercial | 30% |
Percentages may not add up to 100% due to independent rounding
With these adjustments, the industrial, commercial, and residential sectors experience a notable jump, and lead ahead of other categories
Today, the bulk of electricity generation, 60%, comes from natural gas and coal-fired power plants, with nuclear, renewables, and other sources making up 40% of the total.
| Energy Source | 2020 Electric generation, billion kWh | Share of total |
|---|---|---|
| Natural Gas | 1,575 | 38.3% |
| Coal | 899 | 21.8% |
| Nuclear | 778 | 18.9% |
| Wind | 380 | 9.2% |
| Hydropower | 260 | 6.3% |
However, progress and notable strides have been made towards sustainable energy. In 2021, renewables accounted for one-fifth of U.S. electricity generation, roughly doubling their share since 2010.
Coal’s share as a source of electric power has dropped dramatically in recent years. And partially as a result, electricity generation has seen its portion of emissions successfully decrease by 21% , with overall emissions falling from 1,880 million metric tons of CO2 to 1,482 million metric tons.
How Utilities Can Lead the Way
Should these trends persist, the electricity generation sector has a chance to play a pivotal role in the broader decarbonization initiative. And with the bulk of electricity generation in the U.S. coming from investor-owned utilities (IOUs), this is a unique opportunity for IOUs to lead the transition toward cleaner energy.
The National Public Utilities Council is a collaborative body of industry experts coming together to solve decarbonization challenges in the power sector and the proud sponsor of the Decarbonization Channel.
Energy Shift
All Commercially Available Long Duration Energy Storage Technologies, in One Chart
In this chart, we break down the parameters of LDES technologies that have commercial or pre-commercial readiness.

All Commercially Available Long Duration Energy Storage Technologies, in One Chart
Long duration energy storage (LDES) technologies can store electricity for 10+ hours, complementing intermittent renewables, boosting grid resiliency, and reducing fossil fuel dependency.
Created in partnership with the National Public Utilities Council, this chart lists the characteristics of LDES technologies that have commercial or pre-commercial readiness, using data from the LDES Council’s Net-Zero Power report and 2023 deployment update.
The Four Primary Types of LDES
Before getting into the details, let’s cover the four primary types of LDES.
- Mechanical: Stores potential energy (by tension or position)
- Thermal: Stores energy as heat
- Chemical: Stores energy found within chemical bonds
- Electrochemical (batteries): Stores energy of chemical reactions, where electrical energy is converted to chemical energy and vice versa
Currently, mechanical storage systems are the most common around the world. Aboveground pumped hydropower, for instance, currently accounts for 96% of all utility-scale energy storage in the United States.
How Do LDES Technologies Measure Up?
Below, we list the storage capacity, storage duration, and average round-trip efficiency (RTE) of LDES technologies that have commercial or pre-commercial readiness on a global scale.
For context, RTE measures the effectiveness of a storage system by measuring the ratio of energy output to energy input during a full charge-discharge cycle. Or briefly, the higher the RTE, the lower the losses and therefore higher the efficiency.
| Form of Energy Storage | LDES Technology | Storage Capacity (MW) | Nominal Duration (Hours) | Average Round-Trip Efficiency |
|---|---|---|---|---|
| Mechanical | Underground pumped hydro | 10–100 | 0–15 | 50–80% |
| Mechanical | Liquid air | 50–100 | 10–25 | 40–70% |
| Mechanical | Aboveground pumped hydro | 200–400 | 0–15 | 70–80% |
| Mechanical | Liquid CO2 | 10–500 | 4–24 | 70–80% |
| Mechanical | Compressed air | 200–500 | 6–24 | 40–70% |
| Mechanical | Gravity-based | 20–1,000 | 0–15 | 70–90% |
| Thermal | Sensible heat | 10–500 | 200 | 55–90% |
| Chemical | Power-to-gas-to-power | 10–100 | 500–1,000 | 40–70% |
| Electrochemical | Aqueous electrolyte flow battery | 10–100 | 25–100 | 50–80% |
| Electrochemical | Metal anode battery | 10–100 | 50–200 | 40–70% |
| Electrochemical | Hybrid flow battery (with liquid electrolyte and metal anode) | >100 | 8–50 | 55–75% |
The table above shows that a mechanical, gravity-based LDES system can provide the highest storage capacity while presenting an impressive 70–90% average RTE.
On the other hand, a chemical power-to-gas-to-power system, which typically converts electricity to hydrogen gas and back to electricity, provides the highest storage duration of up to 1,000 hours.
With that said, there are different storage needs and siting considerations across electrical grids. Given the diverse range of options available, suitable solutions can be found to complement renewables and aid decarbonization.
Learn how the National Public Utilities Council is working toward the future of sustainable electricity.
Energy Shift
Visualized: The Evolution of Energy Employment (2022–2030P)
This graphic shows the projected evolution of global energy employment between 2022 and 2030 using data by the International Energy Agency.

The Evolution of Energy Employment (2022–2030P)
According to the International Energy Agency (IEA), just over half of the 67 million people employed in the global energy industry in 2022 worked in the clean energy sector: 35 million vs. 32 million in fossil fuels. And with the clean energy transition picking up pace, that gap is set to widen.
In this graphic created in partnership with the National Public Utilities Council, we explore how global energy employment could change by 2030 in a current policy scenario, using projections from the IEA.
The Rise in Clean Energy Employment
The IEA’s current policy scenario is a conservative projection for progress in line with the present trajectory of our energy system. It doesn’t assume that nations will reach their announced goals or that net zero will be achieved by 2050.
Even within this conservative scenario, the global energy sector is projected to have a net gain of 5.7 million jobs by 2030. Except for the 300,000 jobs added in the oil and gas supply industry, these jobs are all in clean energy.
In a more ambitious scenario, aligned with achieving net zero by 2050, the net gain in jobs is projected to nearly triple to 17 million.
| Changes in global energy employment 2022–2030P, millions of jobs | Current policies scenario | Net-zero emissions 2050 scenario |
|---|---|---|
| Coal supply | -1.4 | -2.8 |
| Internal combustion engine vehicles | -1.1 | -6.2 |
| Unabated fossil fuel electricity | -0.2 | -1.2 |
| Critical minerals | +0.2 | +0.7 |
| Oil and gas supply | +0.3 | -2.5 |
| Low-emissions fuels | +0.4 | +3.2 |
| End-use efficiency | +1.2 | +3.2 |
| Energy grids and storage | +1.4 | +3.8 |
| Low-emission electricity | +1.7 | +11 |
| Electric vehicles and batteries | +3.2 | +7.7 |
| Net job creation | +5.7 | +16.9 |
In both scenarios, the global energy industry is poised to create millions of new jobs in the coming years, with the job gains in the clean energy sector significantly outweighing the job losses in the fossil fuel industry.
A People-Centred Transition
With projected growth of this magnitude, the IEA emphasizes that policymakers and industry must support employee transitions from fossil fuels and address skill gaps in emerging industries through education and training.
According to the World Energy Employment report, continued efforts in these areas are crucial to prevent labor shortages and avoid delays in the clean energy transition.
Learn how the National Public Utilities Council is working toward the future of sustainable electricity.

-

 Electrification1 year ago
Visualized: How the Power Grid Works
-

 Energy Shift9 months ago
Ranked: The Cheapest Sources of Electricity in the U.S.
-

 Energy Shift1 year ago
Animated: 70 Years of U.S. Electricity Generation by Source
-

 Clean Energy1 year ago
Breaking Down Clean Energy Funding in the Inflation Reduction Act
-

 Emissions1 year ago
Visualizing Global Per Capita CO2 Emissions
-

 Clean Energy1 year ago
The 30 Largest U.S. Hydropower Plants
-

 Decarbonization1 year ago
The U.S. Utilities Decarbonization Index
-

 Clean Energy7 months ago
Breaking Down the $110 Trillion Cost of the Clean Energy Transition