Decarbonization
Decarbonization Targets for the Largest U.S. Utilities
The following content is sponsored by the National Public Utilities Council
Decarbonization Targets for the Largest U.S. Utilities
This was originally posted on April 23, 2021, on Visual Capitalist.
The U.S. recently rejoined the Paris Climate Agreement and decarbonization is back on the minds of government officials and companies alike.
Though every sector plays a major role on the path to net zero carbon emissions, none are as impactful as the energy sector. In 2016, almost three-quarters of global GHG emissions came from energy consumption. With organizations looking to either curb energy consumption or transition to cleaner forms of energy, the pressure is on utilities to decarbonize and offer green alternatives.
How are U.S. utilities responding?
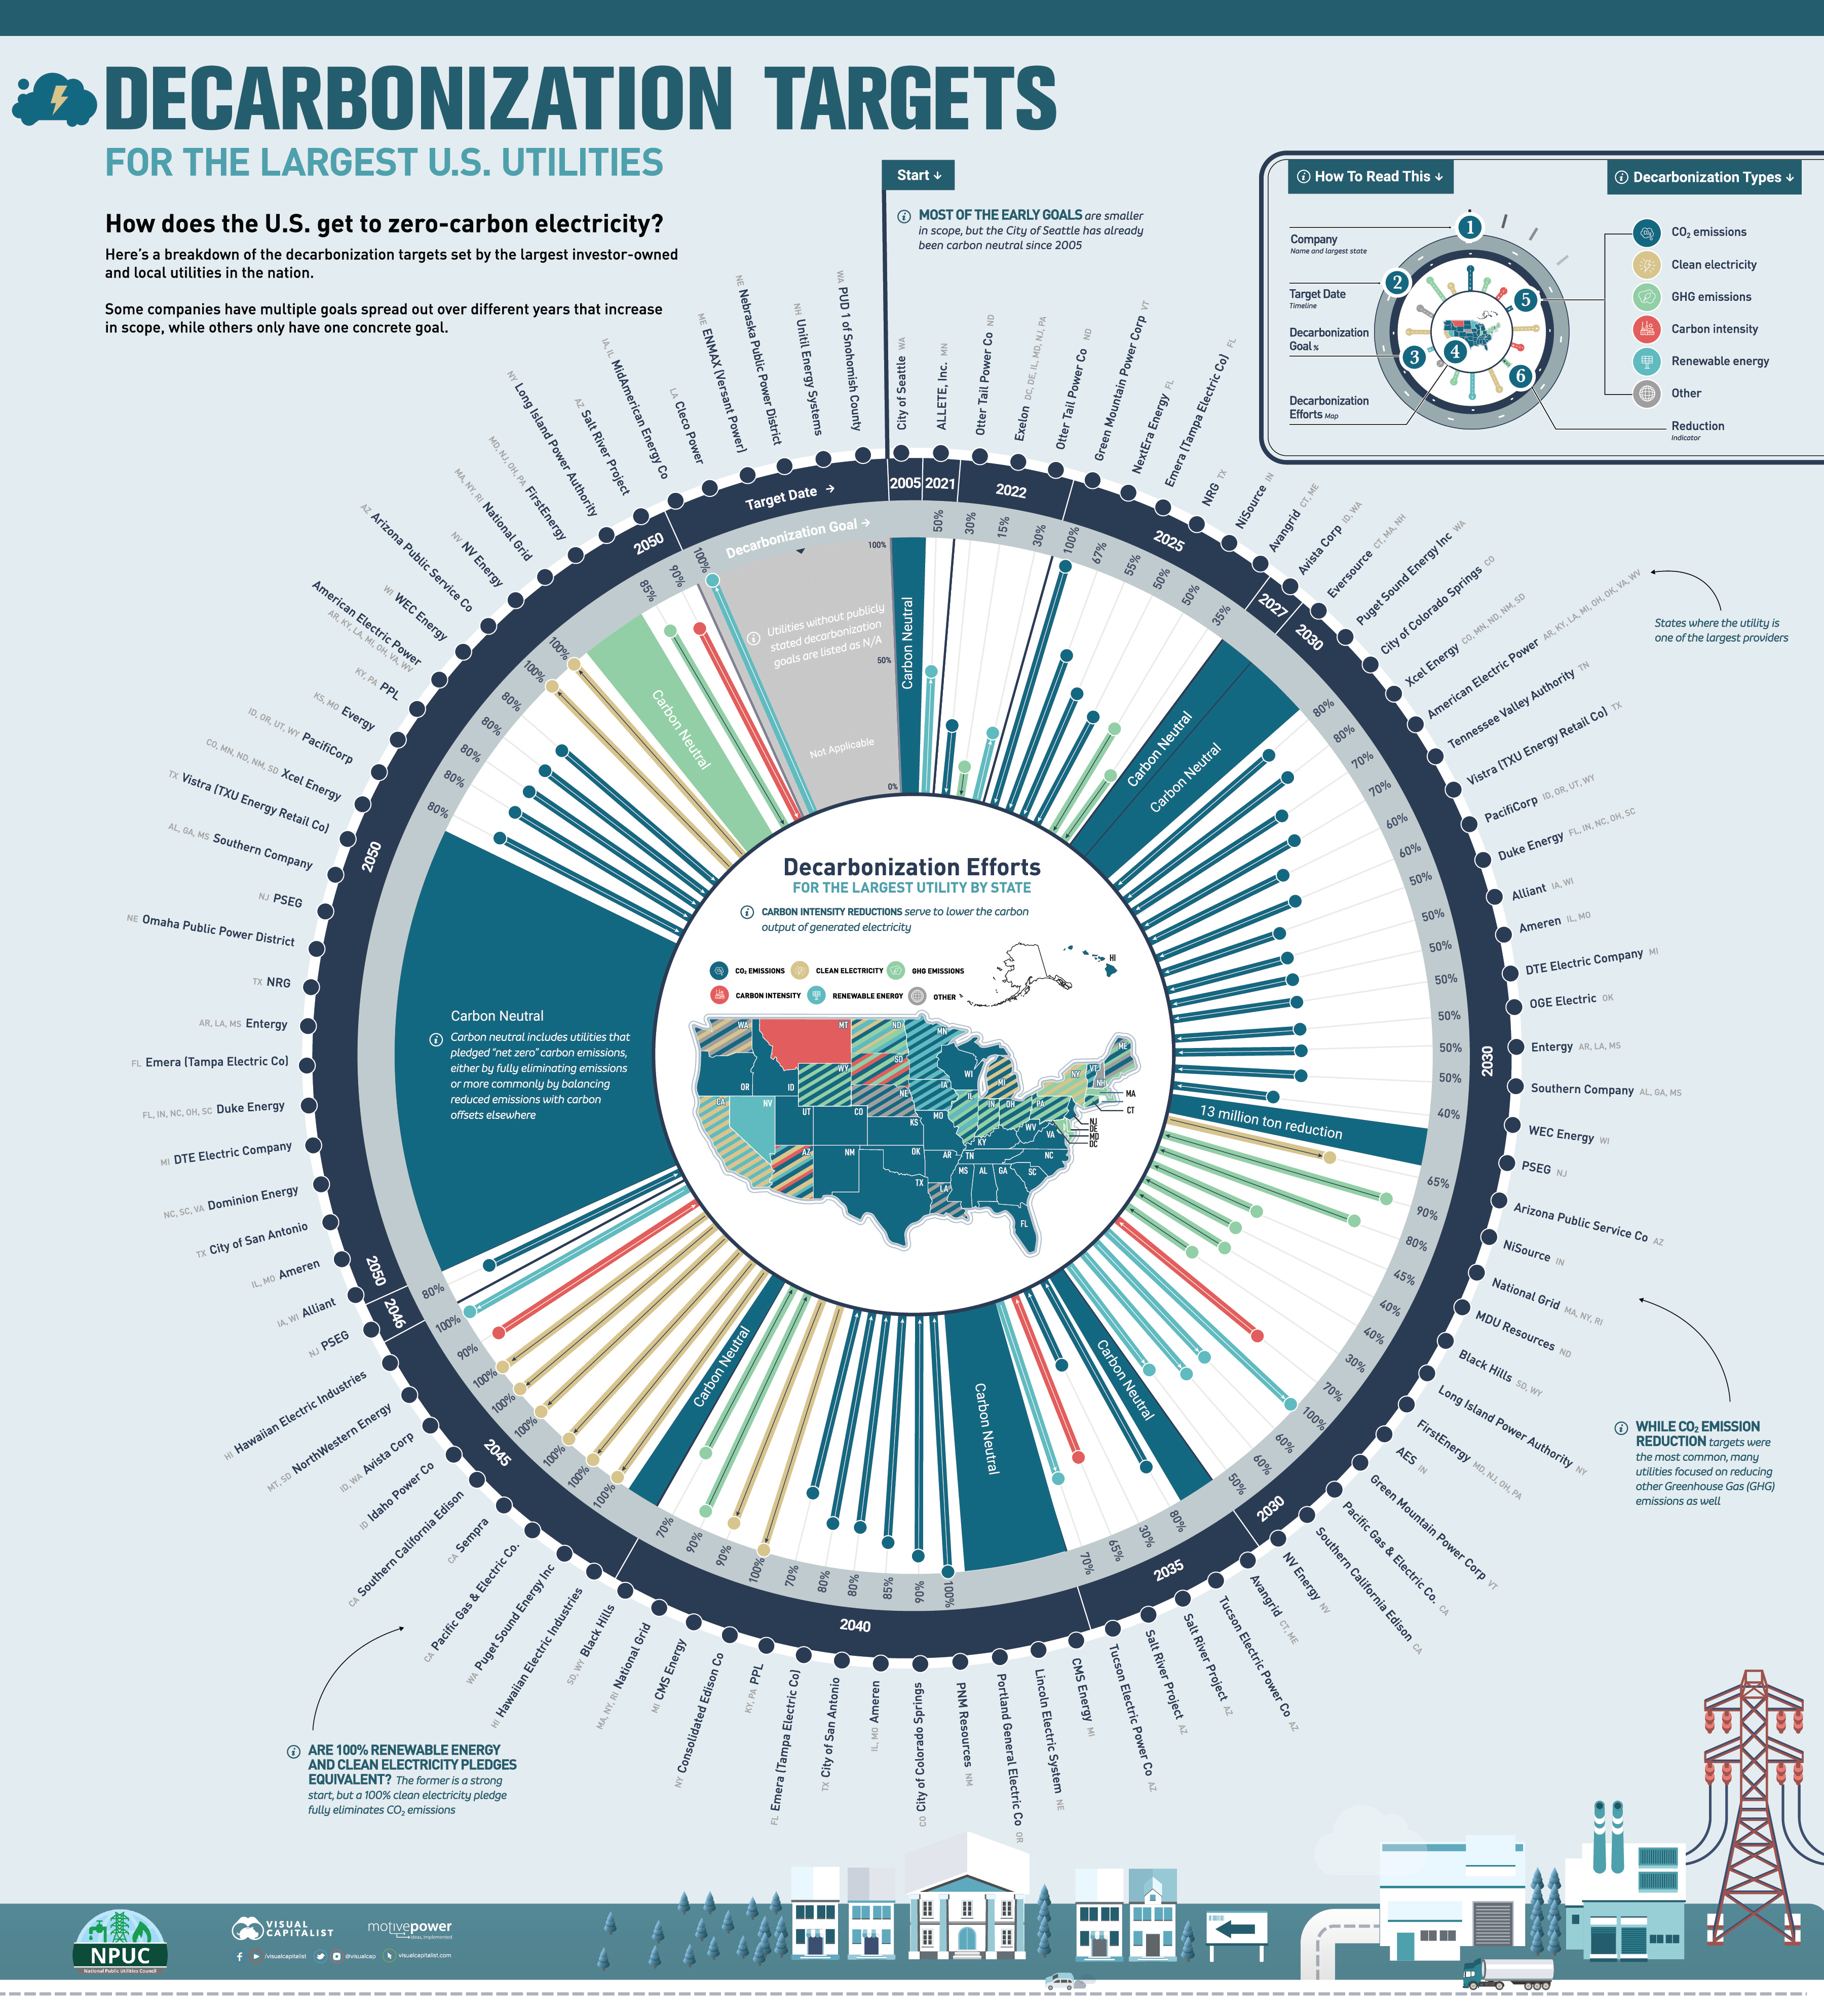
This infographic from the National Public Utilities Council highlights the decarbonization targets of the largest investor-owned and public U.S. utilities.
U.S. Utility Decarbonization Targets Through 2035
The American energy sector has many players, but the largest utilities account for the bulk of production.
For each state, we looked at the largest investor-owned and public electric utilities by retail sales as tracked by the U.S. Energy Information Administration. Decarbonization targets were taken from each utility’s stated goals or sustainability report.
After narrowing down from 3,328 different entities and subsidiaries, the final list of 60 utilities accounted for 60% of U.S. energy sales in 2019 at just under 1.93 trillion MWh (megawatt hours).
Many companies on the list have multiple goals spread across different timeframes, but they can be grouped into a few distinct categories:
- Reducing carbon dioxide (CO2) or greenhouse gas (GHG) emissions: These measures are either percentage-based or flat reductions, and also include becoming carbon neutral or “net zero” by balancing reduced emissions with carbon offsets.
- Reducing carbon intensity: These measures work on reducing the impact of electricity generated by fossil fuels, rather than reducing the amount directly.
- Increasing renewable energy production: These measures focus on adding renewable energy with a lower carbon footprint to the production mix and can be either percentage-based or flat additions.
- Increasing clean electricity production: These measures are centered around ensuring that electricity produced is 100% carbon free.
Utilities with decarbonization targets set for 2035 and earlier vary wildly in scope, from completely carbon neutral to minimal reductions.
| Entity | State (Largest Provider) | Decarbonization Goal | Target Year |
|---|---|---|---|
| City of Seattle | WA | Carbon neutral | 2005 (since) |
| ALLETE | MN | △50% Renewable energy | 2021 |
| Exelon | DC, DE, IL, MD, NJ, PA | ▽15% GHG emissions | 2022 |
| Otter Tail Power | ND | ▽30% CO2 emissions, △30% Renewable energy | 2022 |
| Avangrid | CT, ME | ▽35% GHG emissions | 2025 |
| Emera (Tampa Electric) | FL | ▽55% CO2 emissions | 2025 |
| Green Mountain Power | VT | ▽100% CO2 emissions | 2025 |
| NextEra Energy | FL | ▽67% CO2 emissions | 2025 |
| NiSource | IN | ▽50% GHG emissions | 2025 |
| NRG | TX | ▽50% CO2 emissions | 2025 |
| Avista Corp | ID, WA | Carbon neutral | 2027 |
| AES | IN | ▽70% Carbon intensity | 2030 |
| Alliant | IA, WI | ▽50% CO2 emissions | 2030 |
| Ameren | IL, MO | ▽50% CO2 emissions | 2030 |
| American Electric Power | AR, KY, LA, MI, OK, OH, VA, WV | ▽70% CO2 emissions | 2030 |
| Arizona Public Service | AZ | △65% Clean electricity | 2030 |
| Black Hills | SD, WY | ▽40% GHG emissions | 2030 |
| City of Colorado Springs | CO | ▽80% CO2 emissions | 2030 |
| DTE Electric Company | MI | ▽50% CO2 emissions | 2030 |
| Duke Energy | FL, IN, NC, OH, SC | ▽50% CO2 emissions | 2030 |
| Entergy | AR, LA, MS | ▽50% CO2 emissions | 2030 |
| Eversource | CT, MA, NH | Carbon neutral | 2030 |
| FirstEnergy | MD, NJ, OH, PA | ▽30% GHG emissions | 2030 |
| Green Mountain Power | VT | △100% Renewable energy | 2030 |
| Long Island Power Authority | NY | ▽40% GHG emissions | 2030 |
| MDU Resources | ND | ▽45% GHG emissions | 2030 |
| National Grid | MA, NY, RI | ▽80% GHG emissions | 2030 |
| NiSource | IN | ▽90% GHG emissions | 2030 |
| NV Energy | NV | △50% Renewable energy | 2030 |
| OGE Electric | OK | ▽50% CO2 emissions | 2030 |
| Pacific Gas & Electric | CA | △60% Renewable energy | 2030 |
| PacifiCorp | ID, OR, UT, WY | ▽60% CO2 emissions | 2030 |
| PSEG | NJ | ▽13 million tons CO2 emissions | 2030 |
| Puget Sound Energy | WA | Carbon neutral | 2030 |
| Southern California Edison | CA | △60% Renewable energy | 2030 |
| Southern Company | AL, GA, MS | ▽50% CO2 emissions | 2030 |
| Tennessee Valley Authority | TN | ▽70% CO2 emissions | 2030 |
| Vistra (TXU Energy Retail) | TX | ▽60% CO2 emissions | 2030 |
| WEC Energy | WI | ▽40% CO2 emissions | 2030 |
| Xcel Energy | CO, MN, ND, NM, SD | ▽80% CO2 emissions | 2030 |
| Avangrid | CT, ME | Carbon neutral | 2035 |
| Salt River Project | AZ | ▽65% Carbon intensity, ▽30% CO2 emissions | 2035 |
| Tucson Electric Power | AZ | ▽80% CO2 emissions, △70% Renewable energy | 2035 |
It’s also important to note that carbon emission reductions are not equal across the board.
Reduction is traditionally based on a base-year measurement (usually 2000 or 2005) that changes for each utility, and a small reduction at a major energy producer can be more impactful than 100% clean energy at a small local utility.
U.S. Utility Decarbonization Targets 2040 and Beyond
From 2040 and beyond, the decarbonization efforts become more ambitious.
In line with many states and the federal government making sweeping clean energy commitments, most of the utility companies with decarbonization targets from 2040 to 2050 are aimed at either carbon neutrality or significant reductions.
For some companies these are their first and only targets, while others are building on smaller goals from earlier years. In the case of the few utility companies marked *N/A, a decarbonization target goal couldn’t be found.
| Entity | State (Largest Provider) | Decarbonization Goal | Target Year |
|---|---|---|---|
| Ameren | IL, MO | ▽85% CO2 emissions | 2040 |
| Black Hills | SD, WY | ▽70% GHG emissions | 2040 |
| City of Colorado Springs | CO | ▽90% CO2 emissions | 2040 |
| City of San Antonio | TX | ▽80% CO2 emissions | 2040 |
| CMS Energy | MI | Carbon neutral, △90% Clean electricity | 2040 |
| Consolidated Edison | NY | △100% Clean electricity | 2040 |
| Emera (Tampa Electric) | FL | ▽80% CO2 emissions | 2040 |
| Lincoln Electric System | NE | Carbon neutral | 2040 |
| National Grid | MA, NY, RI | ▽90% GHG emissions | 2040 |
| PNM Resources | NM | ▽100% CO2 emissions | 2040 |
| Portland General Electric | OR | Carbon neutral | 2040 |
| PPL | KY, PA | ▽70% CO2 emissions | 2040 |
| Avista Corp | ID, WA | △100% Clean electricity | 2045 |
| Hawaiian Electric Industries | HI | Carbon neutral, △100% Renewable energy | 2045 |
| Idaho Power | ID | △100% Clean electricity | 2045 |
| NorthWestern Energy | MT, SD | ▽90% Carbon intensity | 2045 |
| Pacific Gas & Electric | CA | △100% Clean electricity | 2045 |
| Puget Sound Energy | WA | △100% Clean electricity | 2045 |
| Sempra | CA | △100% Clean electricity | 2045 |
| Southern California Edison | CA | △100% Clean electricity | 2045 |
| PSEG | NJ | ▽80% CO2 emissions | 2046 |
| Alliant | IA, WI | Carbon neutral | 2050 |
| Ameren | IL, MO | Carbon neutral | 2050 |
| American Electric Power | AR, KY, LA, MI, OK, OH, VA, WV | ▽80% CO2 emissions | 2050 |
| Arizona Public Service | AZ | △100% Clean electricity | 2050 |
| City of San Antonio | TX | Carbon neutral | 2050 |
| Dominion Energy | NC, SC, VA | Carbon neutral | 2050 |
| DTE Electric Company | MI | Carbon neutral | 2050 |
| Duke Energy | FL, IN, NC, OH, SC | Carbon neutral | 2050 |
| Emera (Tampa Electric) | FL | Carbon neutral | 2050 |
| Entergy | AR, LA, MS | Carbon neutral | 2050 |
| Evergy | KS, MO | ▽80% CO2 emissions | 2050 |
| FirstEnergy | MD, NJ, OH, PA | Carbon neutral | 2050 |
| Long Island Power Authority | NY | ▽85% GHG emissions | 2050 |
| National Grid | MA, NY, RI | Carbon neutral | 2050 |
| NRG | TX | Carbon neutral | 2050 |
| NV Energy | NV | △100% Clean electricity | 2050 |
| Omaha Public Power District | NE | Carbon neutral | 2050 |
| PacifiCorp | ID, OR, UT, WY | ▽80% CO2 emissions | 2050 |
| PPL | KY, PA | ▽80% CO2 emissions | 2050 |
| PSEG | NJ | Carbon neutral | 2050 |
| Salt River Project | AZ | ▽90% Carbon intensity | 2050 |
| Southern Company | AL, GA, MS | Carbon neutral | 2050 |
| Vistra (TXU Energy Retail) | TX | Carbon neutral | 2050 |
| WEC Energy | WI | ▽80% CO2 emissions | 2050 |
| Xcel Energy | CO, MN, ND, NM, SD | Carbon neutral | 2050 |
| MidAmerican Energy | IA, IL | △100% Renewable energy | N/A |
| Cleco Power | LA | N/A | N/A |
| ENMAX (Versant Power) | ME | N/A | N/A |
| Nebraska Public Power District | NE | N/A | N/A |
| PUD 1 of Snohomish County | WA | N/A | N/A |
| Unitil Energy Systems | NH | N/A | N/A |
While the targets set above are significant, they are also a long time away from being met. With pressure to decarbonize increasing across the board, utility companies may need to reassess the impact or timeliness of their decarbonization targets.
The National Public Utilities Council is a collaborative body of industry experts coming together to solve decarbonization challenges in the power sector and the proud sponsor of the Decarbonization Channel.
Decarbonization
Unpacking Hydrogen’s Role in Decarbonizing the Electricity Sector
In this infographic, we discuss three ways hydrogen can support the decarbonization of the global electricity sector.
Hydrogen’s Role in Decarbonizing the Electricity Sector
Hydrogen constitutes 75% of the elemental mass in our universe.
According to the International Energy Agency (IEA), it could also play a pivotal role in global decarbonization efforts.
This infographic, created in partnership with the National Public Utilities Council, explores three ways this element could support the decarbonization of the global electricity sector.
Hydrogen 101
First, let’s get a few basics about hydrogen out of the way.
While abundant in nature, hydrogen is rarely found in its elemental state (H2) on Earth, meaning that it needs to be separated from other chemical compounds, such as water (H2O). Once extracted, however, it becomes a versatile and energy-dense fuel source, containing approximately three times the energy content of gasoline or natural gas.
There are several methods to extract hydrogen from compounds. Depending on the production method and energy source, the resulting hydrogen is often categorized by color to show its emission impact.
| Color | Hydrogen Production Method | Energy Source |
|---|---|---|
| Black | Gasification | Coal or Lignite |
| Gray | Steam Methane Reforming (SMR) | Natural Gas |
| Blue | SMR + Carbon Capture and Storage (CCS) | Natural Gas |
| Purple* | Electrolysis | Nuclear Energy |
| Green | Electrolysis | Renewable Energy |
*Purple hydrogen is also referred to as red or pink hydrogen.
Today, black, gray, and blue hydrogen are used in emission-heavy industries such as petroleum refining and ammonia production.
The technology and infrastructure for purple and green hydrogen, on the other hand, are still taking shape. As they progress, these emission-free sources of hydrogen are expected to play a pivotal role in decarbonizing many hard-to-abate sectors, including power.
Three Ways Green Hydrogen Can Help Decarbonize
Now that we’ve covered hydrogen basics, let’s dive into where emission-free hydrogen can fit in the race to decarbonize our global electricity system.
#1: Hydrogen and Natural Gas Blending
Hydrogen can be blended with natural gas in existing pipeline infrastructure for lower-emission power generation.
According to Jenbacher, a 20–30% hydrogen volume can lead to a 7–11% decrease in CO2 emissions, compared to natural gas on its own.
In 2022, U.S. electricity from natural gas generated 743 million metric tons in the United States. A 9% reduction in emissions through hydrogen blending lowers emissions by 67 million metric tons CO2, all without the need to build new infrastructure.
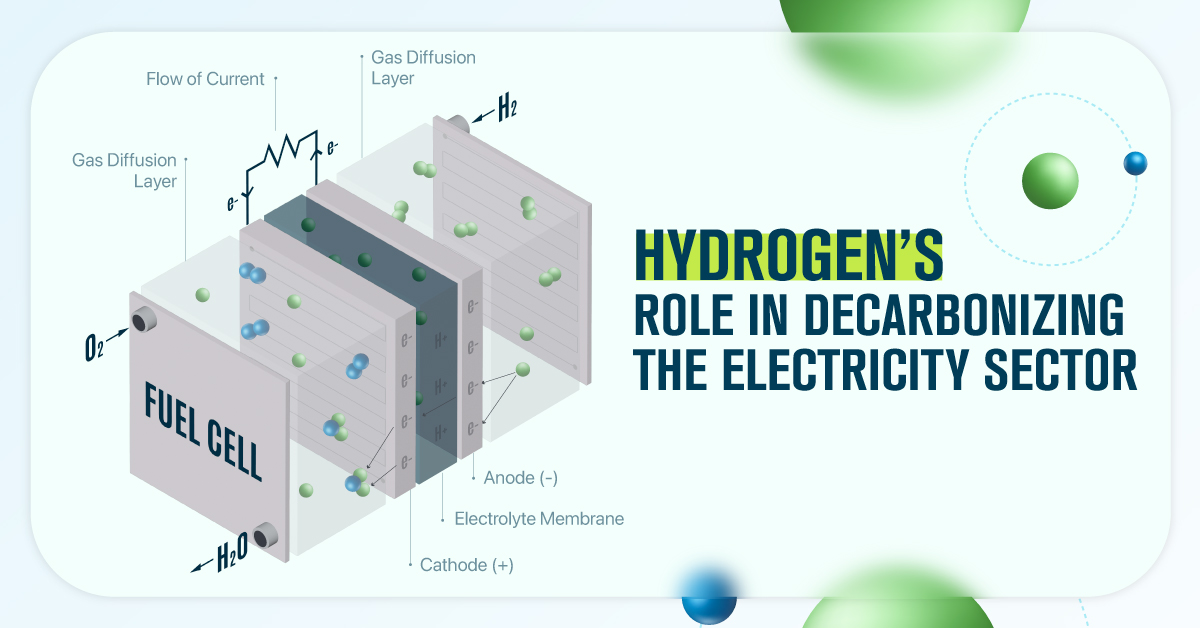
#2: Fuel Cells
A fuel cell generates electricity through an electrochemical reaction between hydrogen and oxygen, with water as the only byproduct.
By using green or pink hydrogen, fuel cells can provide 100% emission-free electricity that is also efficient, reliable, and dispatchable.
#3: Energy Storage
Energy storage plays a pivotal role in decarbonizing the power sector by balancing the intermittent nature of renewables.
While other technologies, such as lithium-ion batteries, can also provide energy storage, hydrogen has a greater potential to offer both large-scale and long-term storage, up to several months at a time.
As technology advances, the IEA predicts that global underground hydrogen capacity will grow by more than 200,000% in the next 30 years, reaching 1,200 TWh in 2050. That amount of energy can power 70,000 U.S. homes for an entire year, underscoring the untapped potential that lies within hydrogen.
Learn how the National Public Utilities Council is working towards the future of sustainable electricity.
Climate
Mapped: Global Temperature Rise by Country (2022-2100P)
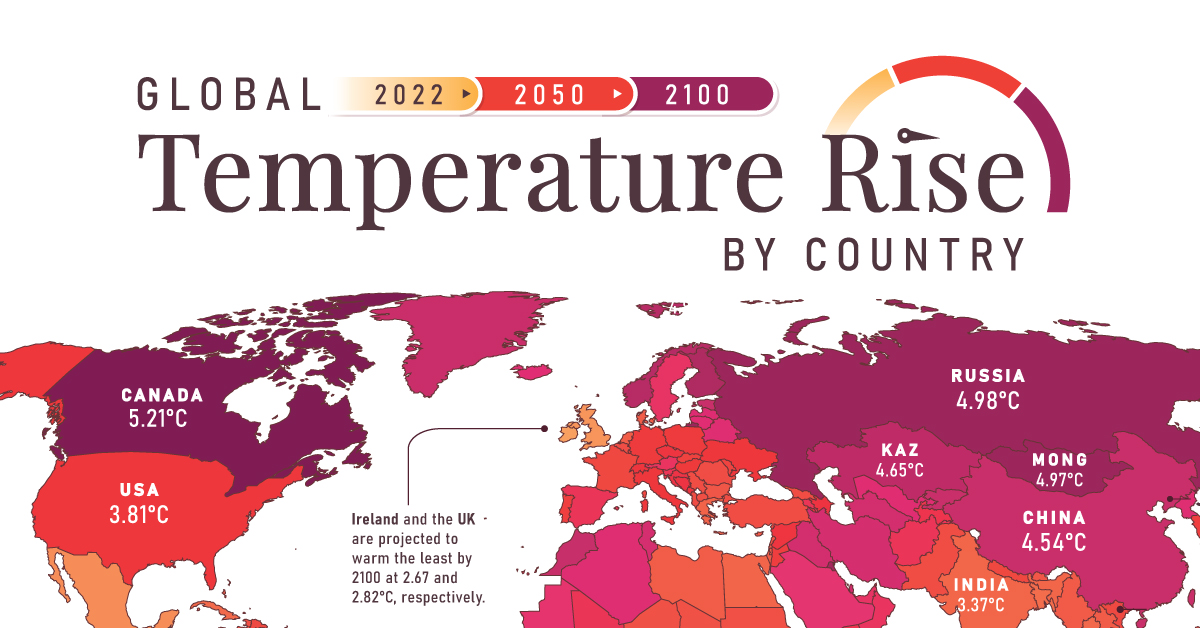
In this set of three maps, we show the global temperature rise on a national level for 2022, 2050, and 2100 based on an analysis by Berkeley Earth.
Mapped: Global Temperature Rise by Country (2022-2100P)
Many scientific authorities, such as the Intergovernmental Panel on Climate Change (IPCC), often discuss the need to limit planetary warming to 2°C above pre-industrial levels.
But did you know that this warming will not be evenly distributed throughout the globe due to factors such as geography, weather patterns, ocean currents, and the influence of human activities?
To discover the current and projected nuances of this uneven warming, these three maps created in partnership with the National Public Utilities Council visualize the global temperature rise by country, using new and updated data from Berkeley Earth.
Current State of Warming
The three maps above visualize warming relative to each country’s average 1850-1900 temperatures.
Looking at warming in 2022, we see that average national warming (i.e. warming excluding oceans) is already 1.81°C above those numbers, with Mongolia warming the most (2.54°C) and Bangladesh warming the least (1.1°C).
As the map depicts, warming is generally more accelerated in the Global North. One of the reasons for this is Arctic amplification.
Arctic amplification refers to the disproportionate heating experienced in the Arctic compared to the rest of the planet. This amplification is fueled by multiple feedback loops, including decreased albedo as ice cover diminishes, leading to further absorption of heat and exacerbating the warming effect.

Arctic amplification. Source: NASA
Aside from modern-day observations, the effects of Arctic amplification are also clearly seen in climate models, where accelerated warming in countries such as Russia and Canada is seen through 2100.
Projected Warming in 2050 and 2100
Moving over to the second and third maps in the slides above, we discover country-level 2050 and 2100 warming projections.
These projections are based on the IPCC’s “middle-of-the-road” scenario, titled Shared Socioeconomic Pathway (SSP) 2-4.5. Out of the various established pathways, this one is the closest to expected emissions under current policies.
2050 Projections
Under the SSP2-4.5 scenario, average national warming is projected to be 2.75°C above average 1850-1900 temperatures in 2050. This includes Mongolia, with the most substantial warming of 3.76°C, and New Zealand, with the mildest warming of 2.02°C.
To put those temperatures into context, here are the risks that would likely accompany them, according to the IPCC’s latest assessment report.
- Extreme weather events will be more frequent and intense, including heavy precipitation and related flooding and cyclones.
- Nearly all ecosystems will face high risks of biodiversity loss, including terrestrial, freshwater, coastal and marine ecosystems.
- Accelerated sea level rise will threaten coastal cities, leading to mass displacement.
Let’s now take a look at 2100 projections, which would have significantly higher levels of risk unless fast and extreme mitigation and adaptation measures are implemented in the upcoming decades.
2100 Projections
2100 projections under the SSP2-4.5 scenario depict an average national warming of 3.80°C.
More than 55 countries across the globe are projected to have warming above 4°C in comparison to their 1850-1900 averages, and nearly 100 above 3.5°C.
Here is what those levels of warming would likely mean, according to the IPCC.
- 3-39% of terrestrial species will face very high risks of extinction.
- Water scarcity will considerably affect cities, farms, and hydro plants, and about 10% of the world’s land area will experience rises in both exceptionally high and exceptionally low river flows.
- Droughts, floods, and heatwaves will pose substantial threats to global food production and accessibility, eroding food security and impacting nutritional stability on a significant scale.
Generally, warming at this level is expected to pose substantial catastrophic risks to humanity, necessitating swift and bold climate action.
Learn more about how electric utilities and the power sector can lead on the path toward decarbonization here.

-

 Electrification1 year ago
Visualized: How the Power Grid Works
-

 Energy Shift9 months ago
Ranked: The Cheapest Sources of Electricity in the U.S.
-

 Energy Shift1 year ago
Animated: 70 Years of U.S. Electricity Generation by Source
-

 Clean Energy1 year ago
Breaking Down Clean Energy Funding in the Inflation Reduction Act
-

 Emissions1 year ago
Visualizing Global Per Capita CO2 Emissions
-

 Clean Energy1 year ago
The 30 Largest U.S. Hydropower Plants
-

 Decarbonization1 year ago
The U.S. Utilities Decarbonization Index
-

 Clean Energy7 months ago
Breaking Down the $110 Trillion Cost of the Clean Energy Transition