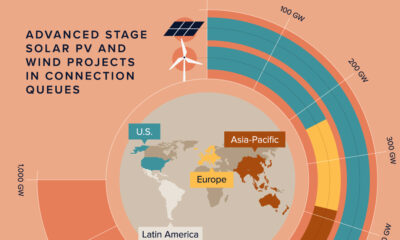

Streamlining processes, investing in infrastructure, and promoting local manufacturing can pave the way for wind and solar adoption.
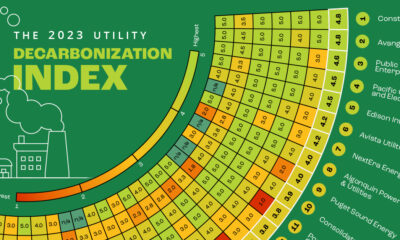

Here is a preview of our 2023 Utility Decarbonization Index, which tracks the decarbonization progress of the largest investor-owned utilities in America.
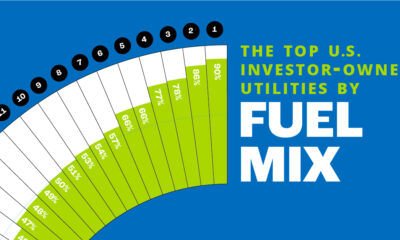

In this chart, we rank the top U.S. utilities by the share of low-carbon sources in their owned electricity generations.
This infographic tracks the extent of electrification in the residential, commercial, industrial, and transportation sectors.
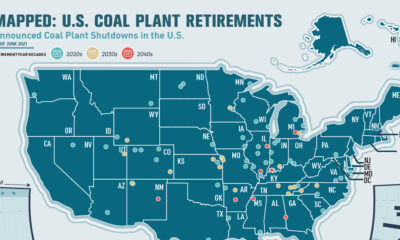

This infographic highlights announced coal plant closures in the U.S. and how much power will be affected.
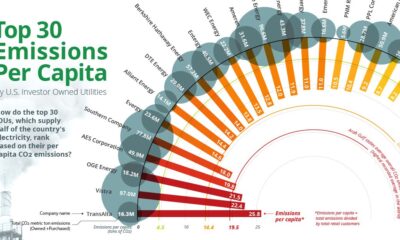

Emissions per Capita of the Top 30 U.S. Investor-Owned Utilities Approximately 25% of all U.S. greenhouse gas emissions (GHG) come from electricity generation. Subsequently, this means...


The U.S. Utilities Decarbonization Index With the Biden administration targeting a zero-emissions power sector for the U.S. by 2035, how are the nation’s largest electric power...
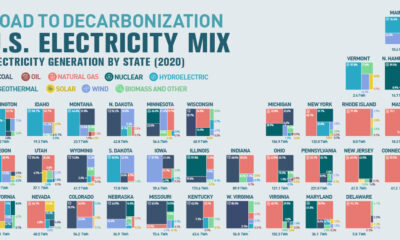

Road to Decarbonization: The United States Electricity Mix This was originally posted on August 31, 2021, on Visual Capitalist. The U.S. response to climate change and...
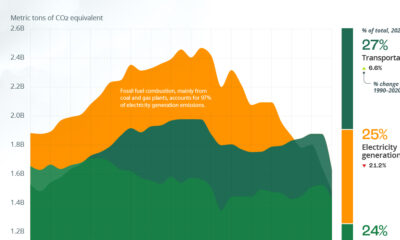

Visualizing U.S. Emissions by Sector Decarbonization efforts in the U.S. are ramping up, and in 2020, greenhouse gas (GHG) emissions were lower than at any point...
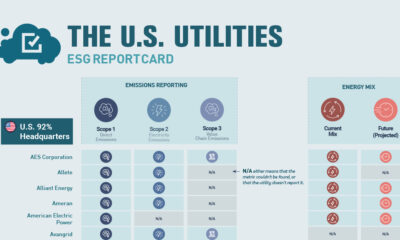

Tracked: The U.S. Utilities ESG Report Card This was originally posted on July 15, 2021, on Visual Capitalist. As emissions reductions and sustainable practices become more...


