Clean Energy
The 30 Largest U.S. Hydropower Plants


The following content is sponsored by the National Public Utilities Council
The 30 Largest Hydropower Plants in the U.S.
Did you know that the largest power plant in the United States is hydroelectric?
Hydropower is the second-largest source of U.S. renewable electricity generation and the largest source of power in seven different states.
The above infographic from the National Public Utilities Council charts the 30 largest U.S. hydropower plants and shows how droughts are starting to affect hydroelectricity. This is part one of two in the Hydropower Series.
Dam, That’s Large: U.S. Hydropower Plants by Generation
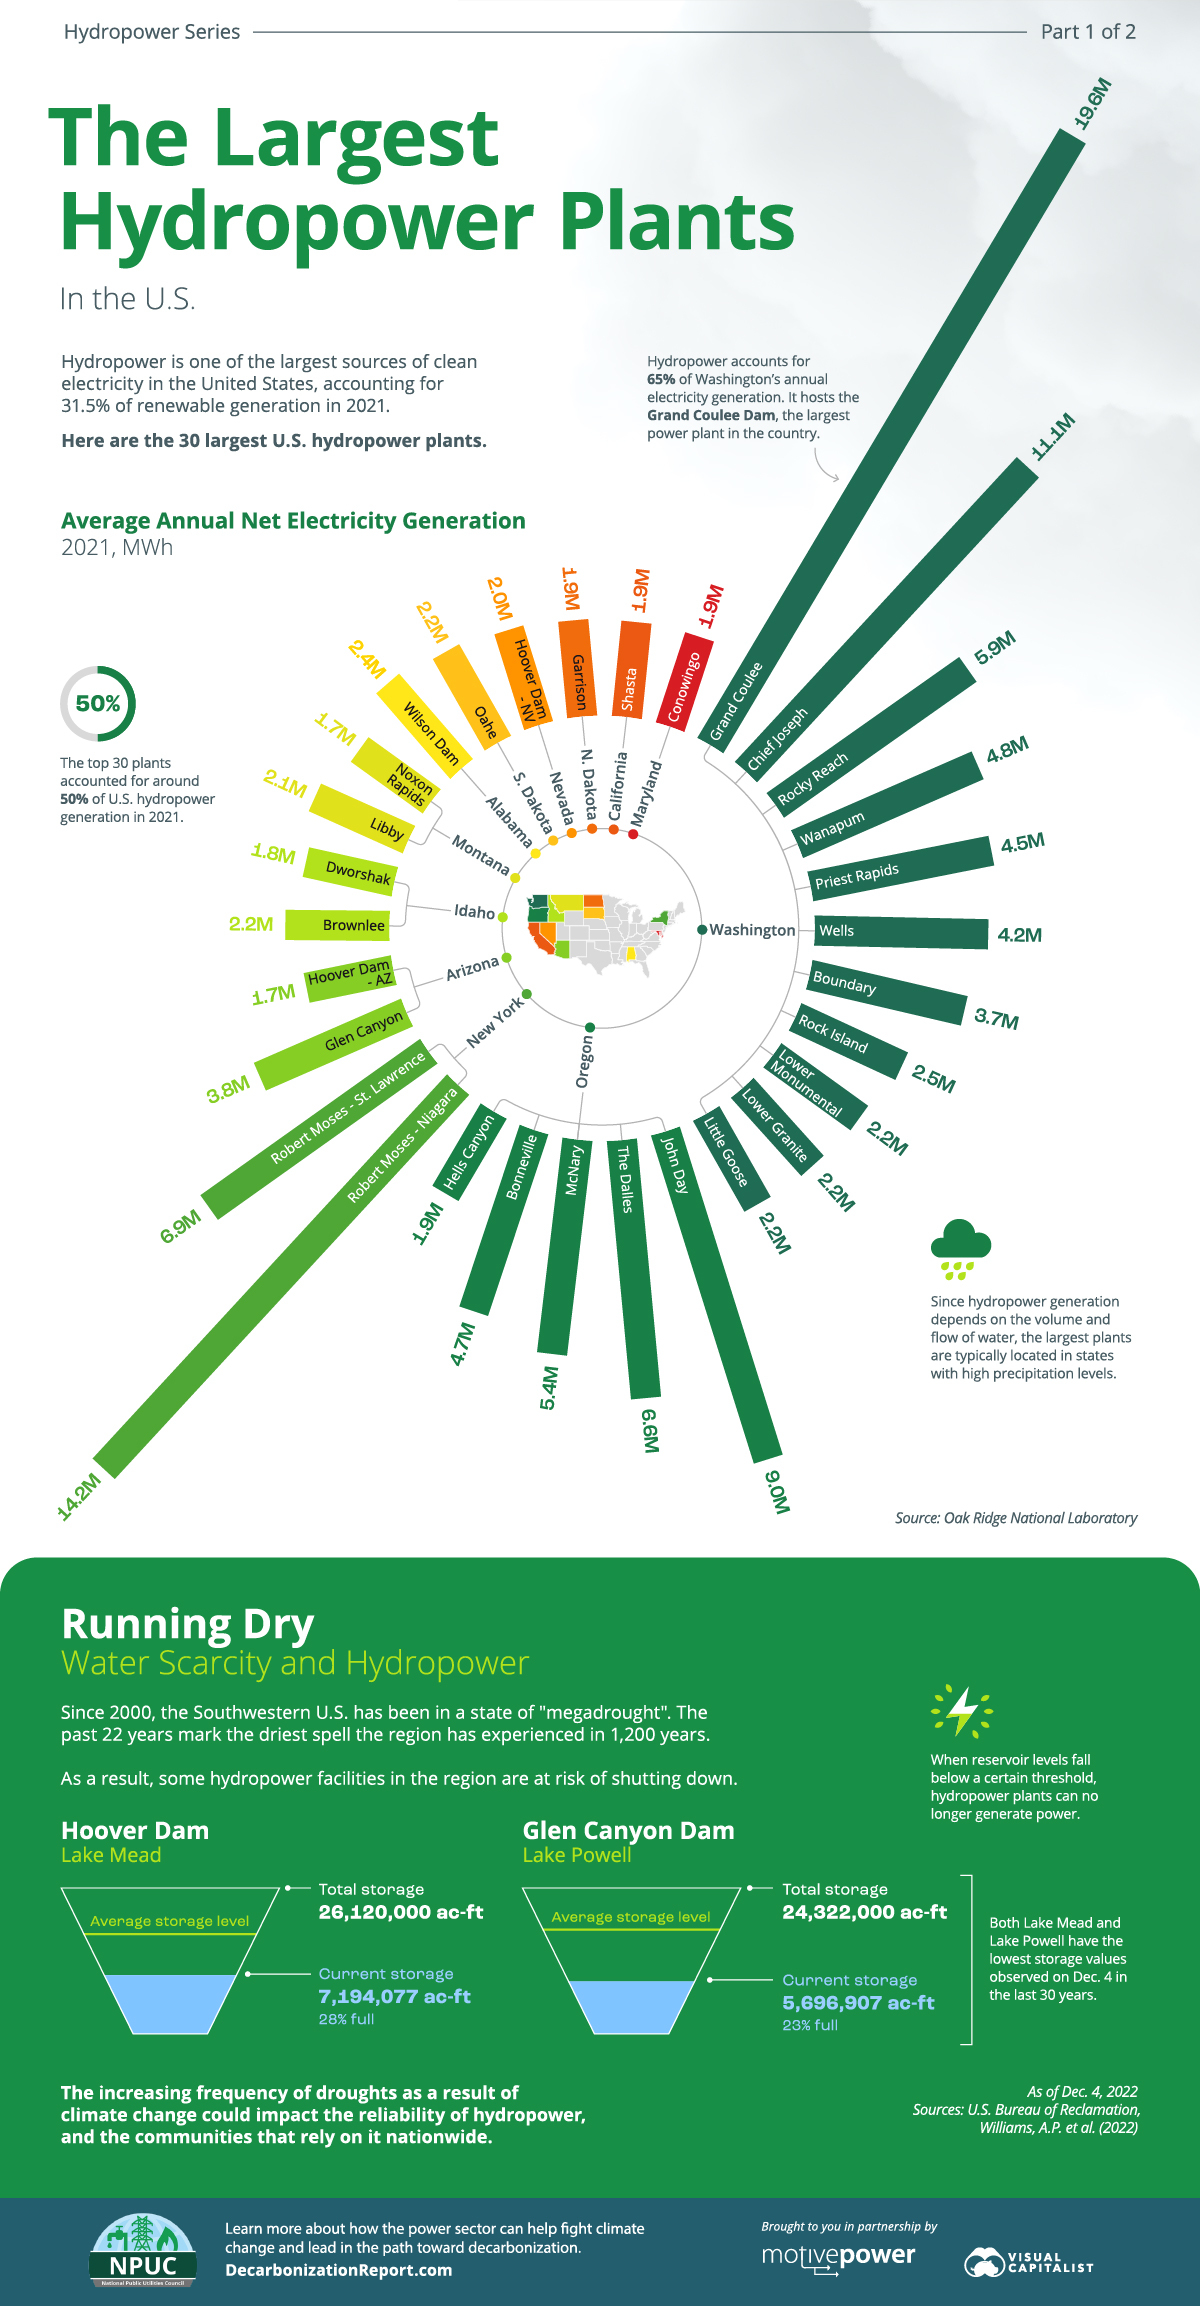
The top 30 hydropower plants account for around 50% of U.S. hydroelectric generation annually.
Hydropower plants are most prevalent in the Northwestern states of Washington and Oregon, jointly hosting 16 of the top 30 plants.
| Plant Name | State | 2021 Avg. Net Electricity Generation (MWh) | % of Total Hydropower Generation |
|---|---|---|---|
| Grand Coulee | Washington | 19,550,777 | 7% |
| Robert Moses - Niagara | New York | 14,186,130 | 5% |
| Chief Joseph | Washington | 11,092,216 | 4% |
| John Day | Oregon | 9,041,083 | 3% |
| Robert Moses - St. Lawrence | New York | 6,906,420 | 3% |
| The Dalles | Oregon | 6,613,185 | 2% |
| Rocky Reach | Washington | 5,935,038 | 2% |
| McNary | Oregon | 5,369,726 | 2% |
| Wanapum | Washington | 4,820,651 | 2% |
| Bonneville | Oregon | 4,659,483 | 2% |
| Priest Rapids | Washington | 4,462,873 | 2% |
| Wells | Washington | 4,153,466 | 2% |
| Glen Canyon | Arizona | 3,772,010 | 1% |
| Boundary | Washington | 3,730,184 | 1% |
| Rock Island | Washington | 2,532,044 | 0.9% |
| Wilson Dam | Alabama | 2,404,440 | 0.9% |
| Lower Monumental | Washington | 2,240,264 | 0.8% |
| Oahe | South Dakota | 2,181,664 | 0.8% |
| Lower Granite | Washington | 2,171,590 | 0.8% |
| Little Goose | Washington | 2,156,654 | 0.8% |
| Brownlee | Idaho | 2,154,411 | 0.8% |
| Libby | Montana | 2,122,863 | 0.8% |
| Hoover Dam - NV | Nevada | 2,044,127 | 0.7% |
| Garrison | North Dakota | 1,941,731 | 0.7% |
| Shasta | California | 1,907,761 | 0.7% |
| Hells Canyon | Oregon | 1,900,591 | 0.7% |
| Conowingo | Maryland | 1,885,395 | 0.7% |
| Dworshak | Idaho | 1,773,911 | 0.6% |
| Hoover Dam - AZ | Arizona | 1,713,563 | 0.6% |
| Noxon Rapids | Montana | 1,710,754 | 0.6% |
| Total | N/A | 137,135,005 | 50% |
The Grand Coulee Dam in Washington is the country’s largest power plant. It generates over 19.5 million megawatt-hours (MWh) of electricity annually and supplies it to eight states, including parts of Canada. Overall, 10 of the top 30 hydropower plants are in Washington.
The Robert Moses Power Plant is a close second, located around 5 miles downstream from Niagara Falls. Combined with the nearby Lewiston Pump Generation Plant, it is New York’s single-largest source of electricity.
While hydropower is a relatively reliable renewable power source, prolonged dry conditions can put it at risk. That is the case for both the Glen Canyon and Hoover Dams, which are no longer running at previous capacities.
Running Dry: Water Scarcity and Hydropower
The Southwestern U.S. has been in a “megadrought”—a prolonged drought lasting longer than two decades—since 2000. In fact, it has gotten so severe that the past 22 years mark the region’s driest spell in 1,200 years.
Consequently, many Southwestern reservoirs have below-average storage levels. When these levels fall below a certain threshold, hydropower plants can no longer generate power.
In particular, storage levels are precariously low at Lake Mead (Hoover Dam) and Lake Powell (Glen Canyon Dam), which supply most of Arizona’s hydroelectricity. They are also the two largest reservoirs in the country.
Here’s a look at how filled these reservoirs are as of Dec. 4, 2022:
| Reservoir | Total Storage (acre ft) | Current Storage (acre ft) | % Full |
|---|---|---|---|
| Lake Mead (Hoover Dam) | 26,120,000 | 7,194,077 | 28% |
| Lake Powell (Glen Canyon Dam) | 24,322,000 | 5,696,907 | 23% |
To put those figures into perspective, here’s an animation looking at Lake Powell’s surface area changes from 2018 to 2022:

Shrinking water levels at reservoirs threaten the reliability of hydropower and the millions of people that rely on it for electricity. As droughts become more frequent due to climate change, what does the future of hydropower look like?
Find out in Part 2 of the Hydropower Series, where we’ll dive deeper into how droughts are affecting dams and how hydropower fits into the bigger decarbonization picture.
Clean Energy
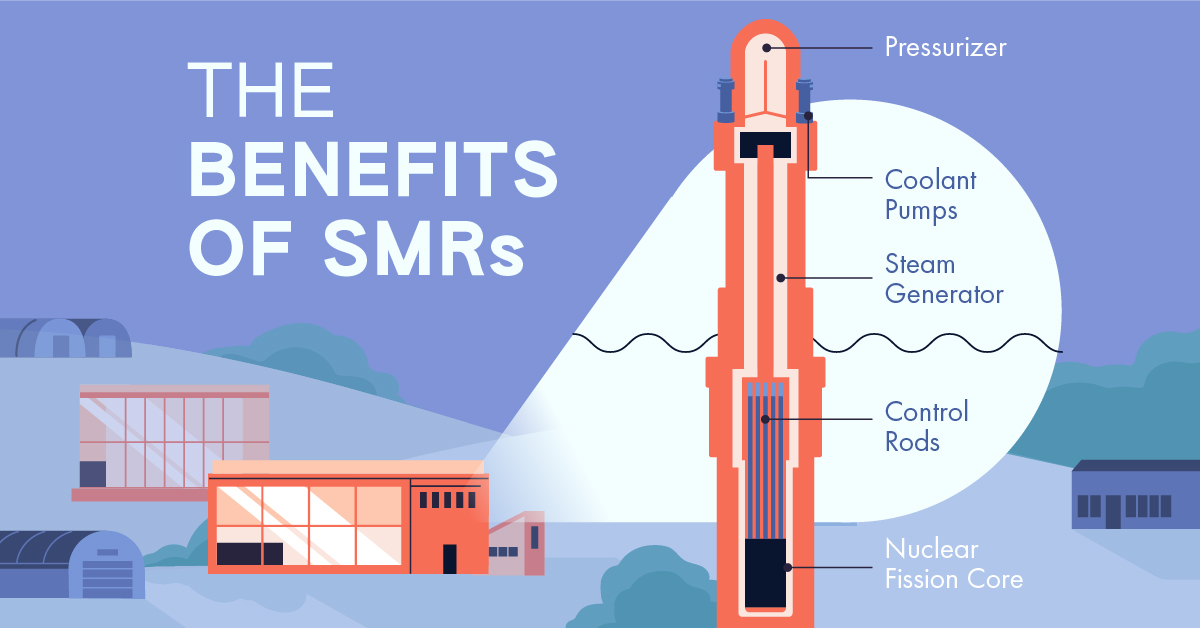
Visualized: The Four Benefits of Small Modular Reactors
What advantages do small modular reactors offer compared to their traditional counterparts?
Visualized: The Four Benefits of Small Modular Reactors
Nuclear power has a crucial role to play on the path to net zero. Traditional nuclear plants, however, can be costly, resource-intensive, and take up to 12 years to come online.
Small modular reactors (SMR) offer a possible solution.
Created in partnership with the National Public Utilities Council, this infographic explores some of the benefits SMRs can offer their traditional counterparts. Let’s dive in.
The Four Key Benefits of SMRs, Explained
An SMR is a compact nuclear reactor that is typically less than 300 megawatts electric (MWe) in capacity and manufactured in modular units.
Here are some of the benefits they offer.
#1: Lower Costs
SMRs require a lower upfront capital investment due to their compact size.
SMRs can also match the per-unit electricity costs of traditional reactors due to various economic efficiencies related to their modular design, including design simplification, factory fabrication, and potential for regulatory harmonization.
#2: Quicker Deployment
Traditional nuclear plants can take up to 12 years to become operational. This is primarily due to their site-specific designs and substantial on-site labor involved in construction.
SMRs, on the other hand, are largely manufactured in factories and are location-independent, which minimizes on-site labor and expedites deployment timelines to as little as three years. This means they can be deployed relatively quickly to provide emissions-free electricity to the grid, supporting growing electricity needs.
#3: Siting Flexibility and Land Efficiency
SMRs have greater siting flexibility compared to traditional reactors due to their smaller size and modular design. In addition, they can utilize land more effectively than traditional reactors, yielding a higher output of electrical energy per unit of land area.
| Rolls-Royce SMR, UK (Proposed) | Median-Sized U.S. Nuclear Plant | |
|---|---|---|
| Capacity | 470 MW | 1,000 MW |
| Area Requirement | 10 Acres* | 832 Acres |
| Land/Space Efficiency | 47 MW/Acre | 1.2 MW/Acre |
*Estimated area requirement
Given their flexibility, SMRs are also suitable for installation on decommissioned coal power plant sites, which can support the transition to clean electricity while utilizing existing transmission infrastructure.
#4: Safety
SMRs have simpler designs, use passive cooling systems, and require lower power and operating pressure, making them inherently safer to operate than traditional reactors.
They also have different refueling needs compared to traditional plants, needing refueling every 3–7 years instead of the 1–2 years typical for large plants. This minimizes the transportation and handling of nuclear fuel, mitigating the risk of accidents.
The Road Ahead
As of early 2024, only five SMRs are operating worldwide. But with several other projects under construction and nearly 20 more in advanced stages of development, SMRs hold promise for expanding global emission-free electricity capacity.
With that said, certain obstacles remain for the wide-scale adoption of SMRs in the United States, which was particularly apparent in the 2023 cancellation of the NuScale SMR project.
To fully realize the benefits of SMRs and advance decarbonization efforts, a focus on financial viability, market readiness, and broader utility and public support may be essential.
Learn how the National Public Utilities Council is working toward the future of sustainable electricity.
Clean Energy
The $3 Trillion Clean Energy Investment Gap, Visualized
In this graphic, we explore the $3 trillion clean energy investment gap visualized by sector, according to BloombergNEF data.
The $3 Trillion Clean Energy Investment Gap, Visualized
Global investment in the clean energy transition grew by 17% in 2023, showing resilience despite geopolitical tensions, high interest rates, and inflation.
But was it enough to keep the world on track to hit net zero by 2050?
To answer this question, we compare 2023 clean energy investment by sector with what’s annually needed to reach net zero by 2050, in partnership with the National Public Utilities Council.
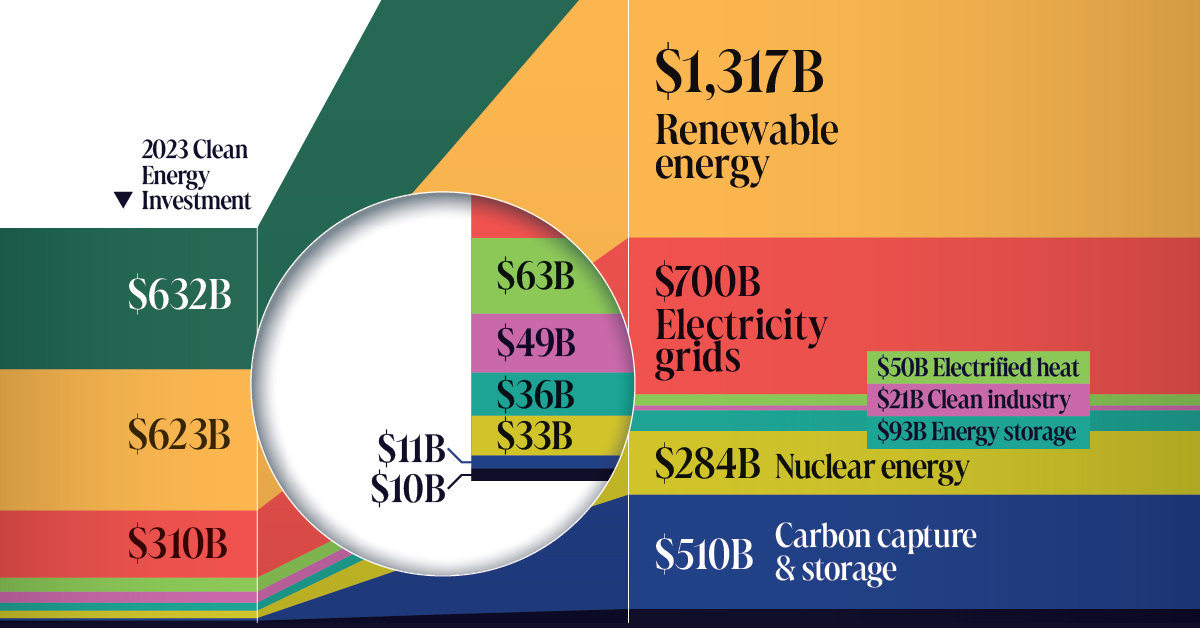
The Investment Gap, By Sector
According to BloombergNEF data, annual global investment in the energy transition is at an all-time high. Despite this, only the electrified heat and clean industry sectors are meeting the thresholds necessary to hit net zero by 2050.
| 2023 Investment | Required Annual Investment for Net Zero*, 2024–2030 | Investment Gap | |
|---|---|---|---|
| Electrified transport | $632B | $1,805B | $1,173B |
| Renewable energy | $623B | $1,317B | $694B |
| Electricity grids | $310B | $700B | $390B |
| Electrified heat | $63B | $50B | -$13B |
| Clean industry | $49B | $21B | -$28B |
| Energy storage | $36B | $93B | $57B |
| Nuclear energy | $33B | $284B | $251B |
| Carbon capture and storage (CCS) | $11B | $510B | $499B |
| Hydrogen | $10B | $62B | $52B |
| TOTAL | $1,767B | $4,842B | $3,075B |
*BloombergNEF’s Net-Zero 2050 Scenario
To stay on track for net zero by 2050, the yearly investments in electrified transport, renewable energy, power grids, and energy storage must more than double their current rates for the rest of the decade.
Hydrogen, nuclear, and carbon capture and storage (CCS) have an even steeper hill to climb and must grow 6, 9, and 46 fold, respectively.
The Path Forward
It’s important to note that despite the current annual investment gap of $3T, the clean energy industry continues to exhibit positive trends.
Investment in electrified transport, for instance, surpassed that in renewable energy for the first time in 2023, marking a win for the sector.
Emerging sectors also experienced robust expansion despite being furthest off-target. Investments in hydrogen tripled to $10B, CCS nearly doubled to $11B, and energy storage witnessed a 76% increase to reach $36B in 2023.
These encouraging developments underscore the industry’s potential to drive transformative change and pave the way for a more sustainable and resilient energy landscape in the years ahead.
Learn how the National Public Utilities Council is working toward the future of sustainable electricity.

-

 Electrification1 year ago
Visualized: How the Power Grid Works
-

 Energy Shift9 months ago
Ranked: The Cheapest Sources of Electricity in the U.S.
-

 Energy Shift1 year ago
Animated: 70 Years of U.S. Electricity Generation by Source
-

 Clean Energy1 year ago
Breaking Down Clean Energy Funding in the Inflation Reduction Act
-

 Emissions1 year ago
Visualizing Global Per Capita CO2 Emissions
-

 Decarbonization1 year ago
The U.S. Utilities Decarbonization Index
-

 Clean Energy7 months ago
Breaking Down the $110 Trillion Cost of the Clean Energy Transition
-
 Climate1 year ago
Visualizing the State of Climate Change