Emissions
Visualizing Global Per Capita CO2 Emissions
Highest Per Capita CO2 Emissions
This was originally published on December 1, 2021, on Visual Capitalist.
Developing countries like China, India, and Russia are some of the highest producers of CO2 worldwide and will be so for a while. But the situation is far from straightforward—and looking at CO2 emissions per capita can add nuance to the overall story.
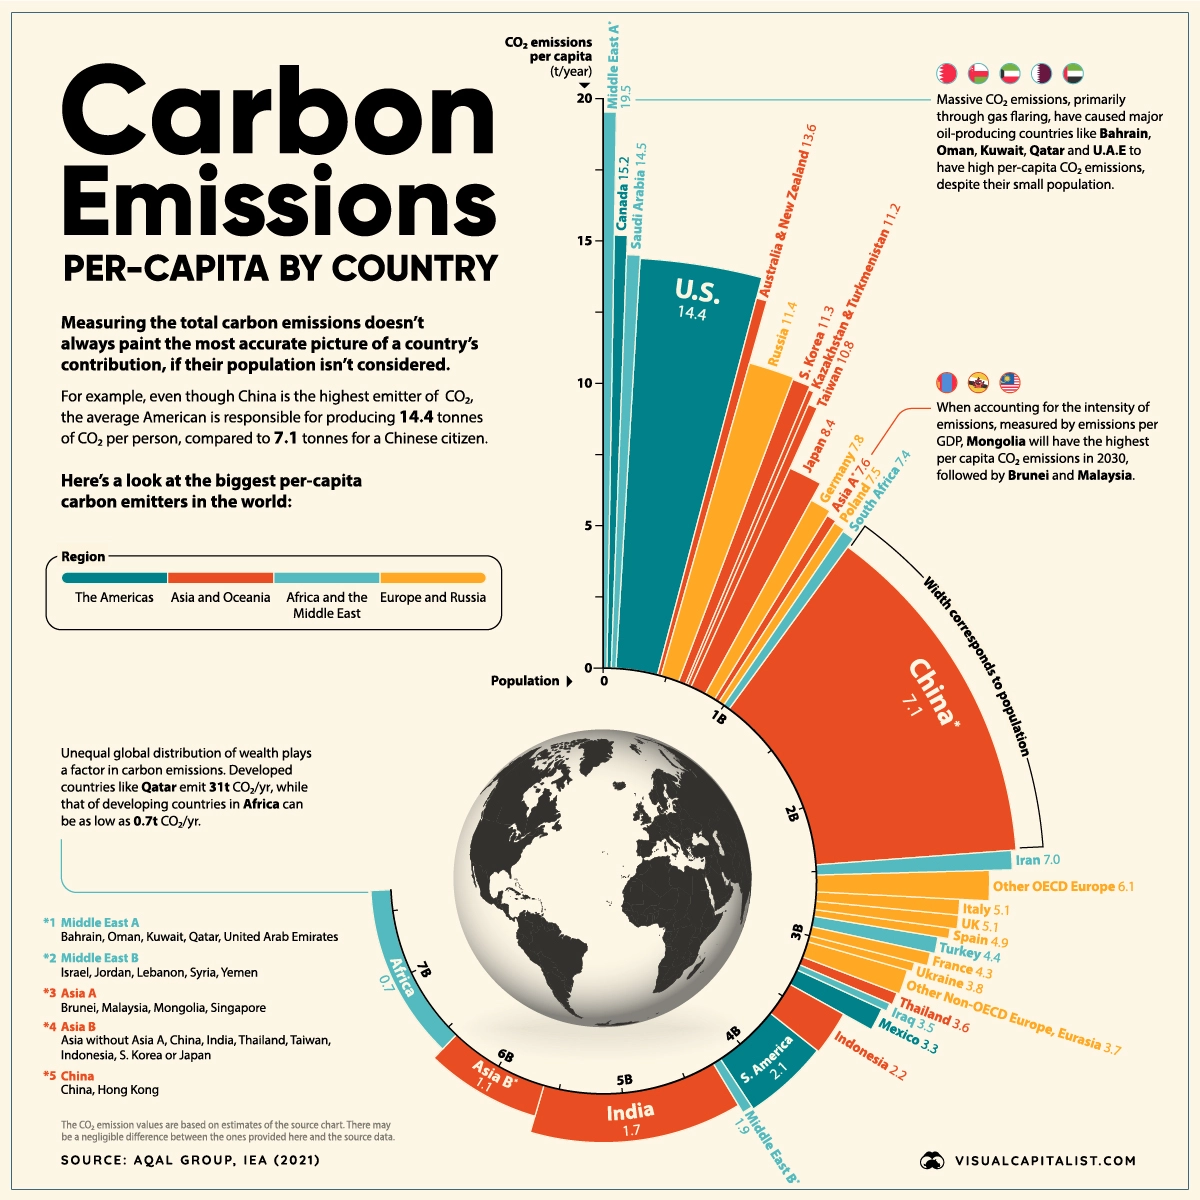
Based on data presented by the Aqal Group and the IEA, here we visualize the countries and regions with the highest per capita carbon emissions from around the world.
Let’s dive into the highest per capita carbon emitters and how they are trying to reduce their carbon contributions.
Leaders in Per Capita CO2 Emissions
Oil-producing countries in the Middle East are the highest emitters of CO2 on a per capita basis, but developed countries like the U.S., Australia, New Zealand, and Canada also have some of the higher rates of per capita emissions.
| Rank | Country or Region | Carbon Emissions Per Capita (t/year) |
|---|---|---|
| #1 | Middle East A* | 19.5 |
| #2 | Canada | 15.2 |
| #3 | Saudi Arabia | 14.5 |
| #4 | United States | 14.4 |
| #5 | Australia & New Zealand | 13.6 |
| #6 | Russia | 11.4 |
| #7 | South Korea | 11.3 |
| #8 | Kazakhstan & Turkmenistan | 11.2 |
| #9 | Taiwan | 10.8 |
| #10 | Japan | 8.4 |
| Global Average | 4.4 |
*Middle East A group includes Bahrain, Oman, Kuwait, Qatar, and United Arab Emirates
Canada and the United States have per capita carbon footprints of 15.2 and 14.4 tonnes per year, respectively. Meanwhile, Australia and New Zealand combine for an average per capita footprint of over 13.6 tonnes per year.
It’s worth noting that all of these numbers are more than three times higher than the global average, which in 2019 was 4.4 tonnes per person.
Energy Sources and Per Capita CO2 Emissions
Since there is a strong relationship between wealth and per capita CO2 emissions, we’d expect countries with high living standards to have a high carbon footprint.
But the data above shows significant differences in per capita emissions, even between countries with similar living standards. Many countries across Europe, for example, have much lower emissions than the U.S., Canada, or Australia.
Here’s a look at the top 25 countries by standard of living and their share of electricity production from fossil fuels:
| Rank | Country | Per Capita Electricity Consumption (kWh) | % Electricity Production (from fossil fuels) |
|---|---|---|---|
| 1 | 🇫🇮 Finland | 12,174 | 15.6% |
| 2 | 🇩🇰 Denmark | 5,015 | 21.8% |
| 3 | 🇳🇴 Norway | 26,492 | 1.2% |
| 4 | 🇧🇪 Belgium | 7,414 | 34.6% |
| 5 | 🇸🇪 Sweden | 16,478 | 2.2% |
| 6 | 🇨🇭 Switzerland | 7,935 | 1.0% |
| 7 | 🇳🇱 Netherlands | 7,264 | 71.5% |
| 8 | 🇫🇷 France | 8,097 | 9.5% |
| 9 | 🇩🇪 Germany | 6,771 | 43.8% |
| 10 | 🇯🇵 Japan | 7,446 | 69.1% |
| 11 | 🇬🇧 United Kingdom | 4,500 | 40.7% |
| 12 | 🇨🇦 Canada | 16,648 | 16.6% |
| 13 | 🇰🇷 South Korea | 10,458 | 65.8% |
| 14 | 🇺🇸 United States | 12,235 | 60.1% |
| 15 | 🇹🇼 Taiwan | 11,091 | 82.8% |
| 16 | 🇦🇹 Austria | 7,716 | 20.7% |
| 17 | 🇦🇺 Australia | 9,857 | 75.1% |
| 18 | 🇮🇪 Ireland | 6,408 | 59.3% |
| 19 | 🇸🇬 Singapore | 8,542 | 96.7% |
| 20 | 🇪🇸 Spain | 5,641 | 34.4% |
| 21 | 🇮🇹 Italy | 4,554 | 56.8% |
| 22 | 🇨🇿 Czech Republic | 7,534 | 50.7% |
| 23 | 🇵🇹 Portugal | 5,100 | 41.2% |
| 24 | 🇳🇿 New Zealand | 8,880 | 18.9% |
| 25 | 🇱🇺 Luxembourg | 1,529 | 28.5% |
Sources: Electricity consumption, Fossil fuel mix
The choice of energy sources plays a key role here. In the UK, Portugal, and France, a much higher share of electricity is produced from nuclear and renewable sources.
For example, only 9.5% of France’s electricity production comes from fossil fuels, compared to other developed countries like the U.S. at 60.1% and Japan at 69.1%.
G20 Countries and Carbon Emissions
This reliance on fossil fuels for energy production extends to the rest of the G20 countries. According to the Climate Transparency Report, CO2 emissions will rise by 4% across the G20 group this year, dropping 6% in 2020 due to the pandemic.
This rise is mainly due to the increase in coal consumption across these countries. Coal consumption is projected to rise by almost 5% in 2021, with this growth driven by China (accounting for 61% of the growth), the U.S. (18%), and India (17%).
Here’s a look at the current coal power capacity of each G20 country:
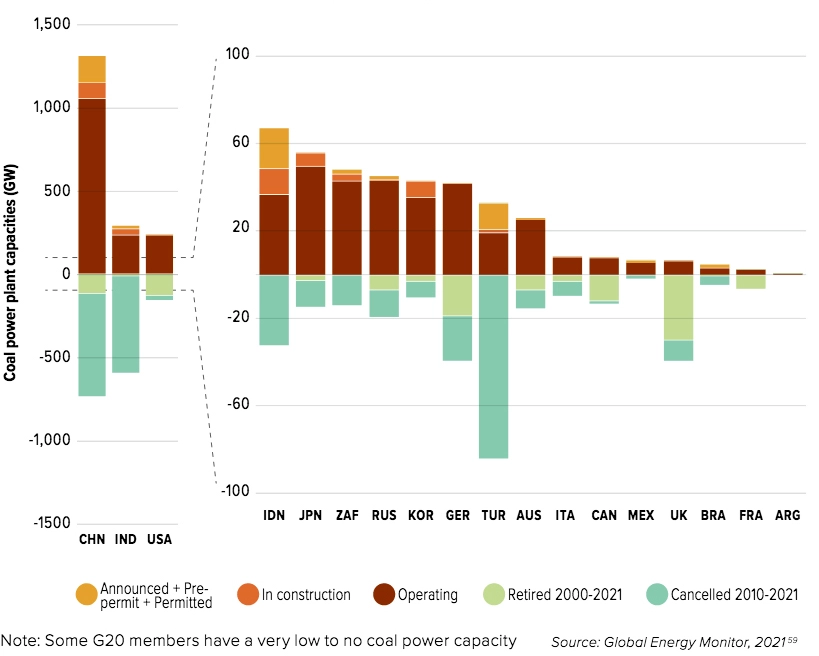
Coal use in China has surged, with the country experiencing increased demand for energy as the global economy has recovered. Coal prices are up nearly 200% from a year ago.
Plans to Tackle Emissions
The conclusion of the U.N. Climate Change Conference (COP26) in Glasgow saw several pledges and announcements being made by various countries. Here are some of the highlights:
- The world’s biggest CO2 emitters, the U.S. and China, pledged to cooperate more over the next decade in areas including methane emissions and the switch to clean energy.
- Leaders from more than 100 countries—with about 85% of the world’s forests—promised to stop deforestation by 2030.
- More than 100 countries agreed upon a scheme to cut 30% of methane emissions by 2030.
- Financial organizations have agreed to back renewable energy and direct finance away from fossil fuel-burning industries.
Many countries have pledged to do their part to tackle climate change. It will be an impressive display of global unity if global CO2 emissions drop significantly over the next decade.
Emissions
Visualized: Global CO2 Emissions Through Time (1950–2022)
In this streamgraph, we break down global CO2 emissions between 1950 and 2022 using data from Berkeley Earth and Global Carbon Project.
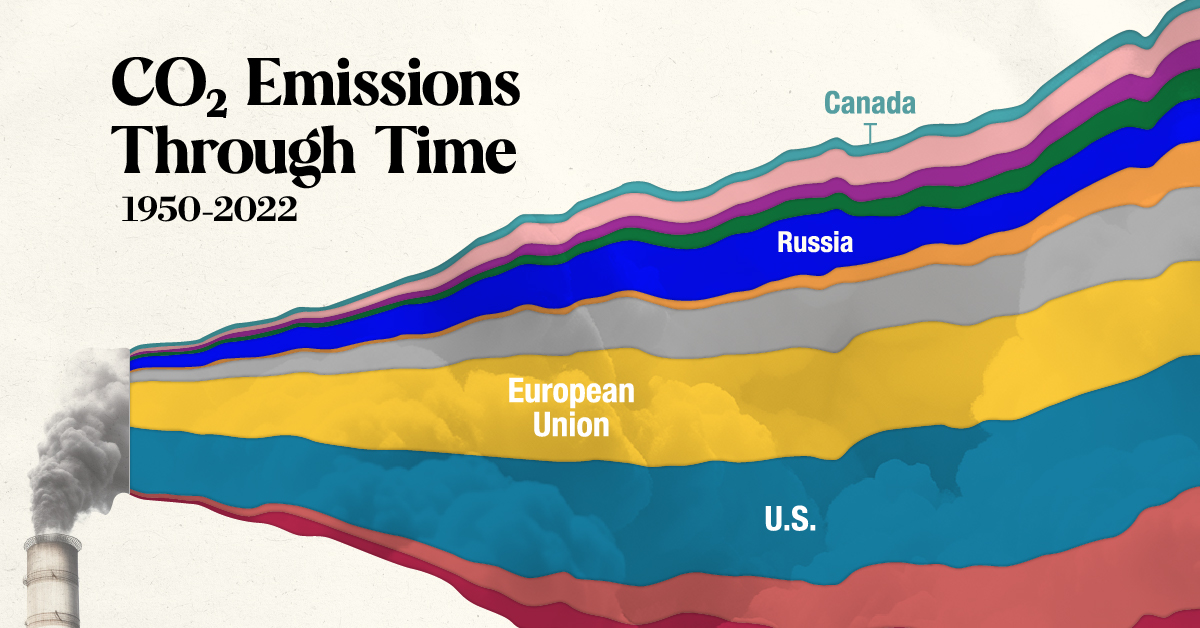
Visualized: Global CO2 Emissions Through Time (1950-2022)
Global CO2 emissions have grown six-fold since 1950.
But which countries have contributed the most to this growth?
In this streamgraph, created in partnership with the National Public Utilities Council, we answer that question using regional emissions data from Berkeley Earth and Global Carbon Project.
Global CO2 Emissions: The Last 70 Years in Review
In the 1950s, the United States and the countries that later formed the European Union (EU) were the biggest emitters in the world, responsible for over 70% of total annual emissions.
However, this trend swiftly changed as other nations entered the fray.
For instance, China’s economic surge in the 1970s, particularly with the advent of Deng Xiaoping’s new economic strategy in 1978, triggered a notable uptick in the country’s CO2 output. From 1950 to 2000, China witnessed a surge of over 4,500% in emissions, reaching an annual 3.6 billion tonnes by 2000.
Similarly, India, Japan, and the broader Asian region, all experienced emission growth exceeding 1,000% between 1950 and 2000.
| Metric tons of carbon dioxide (tCO2) | 1950 | 2000 | 2022 | Change 1950–2000 | Change 2000–2022 |
|---|---|---|---|---|---|
| China | 0.1B | 3.6B | 11.4B | 4,529% | 213% |
| Asia (excl. China, Japan, and India) | 0.2B | 3.2B | 6.2B | 1,973% | 95% |
| United States of America | 2.5B | 6.0B | 5.1B | 136% | -16% |
| European Union | 1.8B | 4.2B | 3.1B | 134% | -26% |
| Rest of World | 0.4B | 2.5B | 2.9B | 465% | 16% |
| India | 0.1B | 1.0B | 2.8B | 1,500% | 189% |
| Russia | 0.4B | 1.5B | 1.7B | 256% | 12% |
| Africa | 0.1B | 0.9B | 1.4B | 876% | 52% |
| Japan | 0.1B | 1.3B | 1.1B | 1,132% | -17% |
| South America | 0.1B | 0.8B | 1.1B | 621% | 34% |
| Canada | 0.2B | 0.6B | 0.6B | 268% | -3% |
Data note: 1950 was used as a beginning point for the graph due to the lack of available data for many countries prior to that year.
As illustrated in the table above, the growth in global carbon emissions has slowed since 2000.
With that said, global emissions have still risen from 25 billion tonnes in 2000 to 37 billion in 2022, yet another all-time high. Today, over 40% of emissions come from the United States and China, underscoring their pivotal roles in shaping the global emissions landscape.
Where Are We Headed From Here?
The United Nations’ recent Emissions Gap report highlights a concerning reality: the ongoing rate of emissions combined with existing policies steers humanity towards a world that is 3°C warmer than pre-industrial levels. This contrasts starkly with the goals of 1.5–2°C agreed to in 2015.
The Intergovernmental Panel on Climate Change projects that such a degree of warming will bring catastrophic repercussions, from severe changes in weather patterns to rising sea levels, widespread extinctions, and critical disruptions to global food and water systems.
This underscores the critical need for swift, concerted action to curb emissions and mitigate the impending environmental challenges that are potentially before us.
Learn more about how electric utilities and the power sector can lead on the path toward decarbonization here.
Emissions
Visualized: Per Capita Electricity Emissions, by State
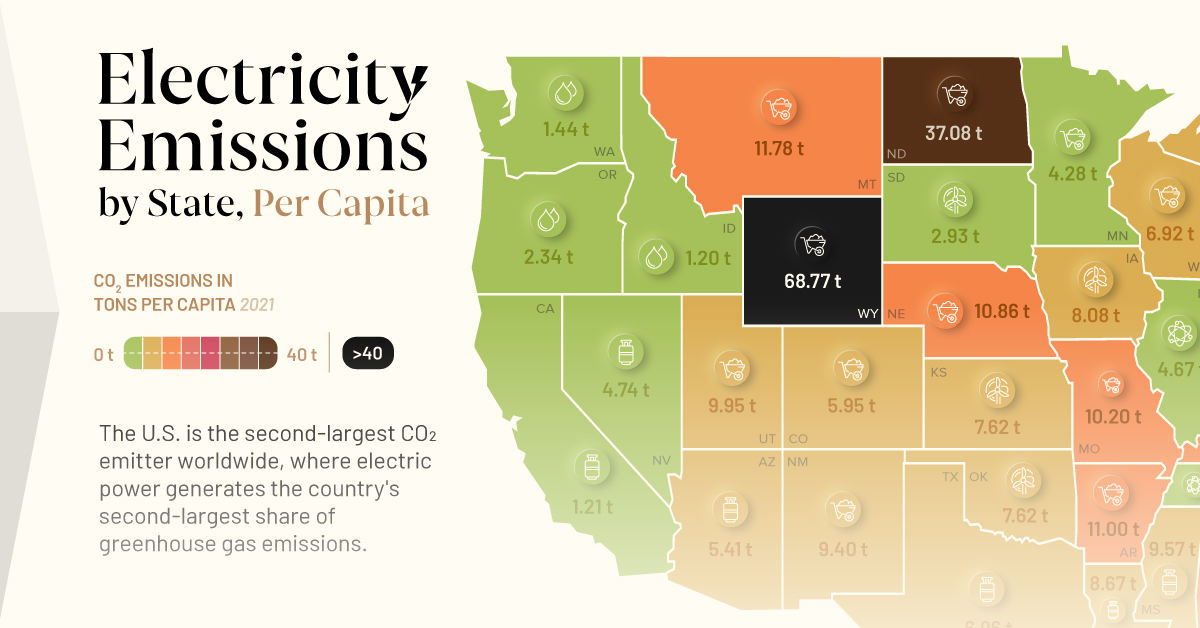
This graphic showcases electricity emissions by state, highlighting each state’s largest source of power.
Per Capita Electricity Emissions by State
The U.S. is the second-largest CO₂ emitter worldwide, with electric power contributing significantly to the country’s greenhouse gas (GHG) emissions.
In collaboration with the National Public Utilities Council, this graphic uses data from eGrid to showcase per-capita electricity emissions by state and each state’s largest source of power.
U.S. Power Sector: Second in CO₂ Emissions
According to the Global Carbon Atlas, the top three global polluters are China, the U.S., and India—accounting for half of the world’s CO₂ emissions.
The U.S., however, leads by far in terms of CO₂ emissions per capita, with 15.3 metric tons per person, while China and India have lower rates at 7.4 and 1.9, respectively.
A substantial portion of these emissions comes from electricity generation. According to the United States Environmental Protection Agency, the electric power sector is the second-largest source of U.S. greenhouse gas emissions, contributing 25% to the total.
Examining emissions per state, Wyoming, North Dakota, and West Virginia top the list of CO₂ emissions per capita, relying primarily on coal as their source of energy.
Here is a table showing emissions by state per capita, from highest to lowest:
| State | CO2 emissions in tons per capita (2021) | Biggest Source of Electricity (2021) |
|---|---|---|
| Wyoming | 68.77 t | Coal |
| North Dakota | 37.08 t | Coal |
| West Virginia | 35.84 t | Coal |
| Kentucky | 13.40 t | Coal |
| Montana | 11.78 t | Coal |
| Indiana | 11.28 t | Coal |
| Arkansas | 10.97 t | Coal |
| Nebraska | 10.87 t | Coal |
| Alabama | 10.61 t | Natural Gas |
| Missouri | 10.20 t | Coal |
| Utah | 9.95 t | Coal |
| Mississippi | 9.57 t | Natural Gas |
| New Mexico | 9.40 t | Coal |
| Louisiana | 8.67 t | Natural Gas |
| Iowa | 8.08 t | Wind |
| Kansas | 8.07 t | Wind |
| Oklahoma | 7.62 t | Wind |
| Texas | 6.96 t | Natural Gas |
| Wisconsin | 6.92 t | Coal |
| Pennsylvania | 6.74 t | Natural Gas |
| Ohio | 6.45 t | Natural Gas |
| Colorado | 5.95 t | Coal |
| Michigan | 5.76 t | Coal |
| Arizona | 5.41 t | Natural Gas |
| South Carolina | 5.36 t | Nuclear |
| Nevada | 4.74 t | Natural Gas |
| Hawaii | 4.73 t | Petroleum |
| Florida | 4.70 t | Natural Gas |
| Illinois | 4.67 t | Nuclear |
| Georgia | 4.36 t | Natural Gas |
| Minnesota | 4.28 t | Coal |
| Alaska | 4.13 t | Natural Gas |
| North Carolina | 4.11 t | Natural Gas |
| Tennessee | 3.96 t | Nuclear |
| Rhode Island | 3.54 t | Natural Gas |
| Virginia | 3.22 t | Natural Gas |
| Connecticut | 3.13 t | Natural Gas |
| South Dakota | 2.93 t | Wind |
| Oregon | 2.34 t | Hydro |
| Maryland | 2.16 t | Nuclear |
| New Hampshire | 1.88 t | Nuclear |
| Delaware | 1.86 t | Natural Gas |
| New Jersey | 1.59 t | Natural Gas |
| Washington | 1.44 t | Hydro |
| New York | 1.42 t | Natural Gas |
| California | 1.21 t | Natural Gas |
| Idaho | 1.20 t | Hydro |
| Maine | 1.19 t | Hydro |
| Massachusetts | 1.18 t | Natural Gas |
| District of Columbia | 0.09 t | Natural Gas |
| Vermont | 0.06 t | Hydro |
Interestingly, from the top 10 on our list, only Alabama doesn’t have coal as the main source of electricity.
Conversely, four of the 10 states with the lowest CO₂ emissions per capita rely more heavily on renewables, especially hydropower.
Two of the largest consumers, California and Texas, have natural gas as their main source of electricity, but also maintain a significant share of renewable sources, with 34% and 44%, respectively.
Although coal accounted for 59% of CO₂ emissions from the energy sector, it represented only 23% of the electricity generated in the United States. Natural gas accounted for 37% of electricity generation in 2021.
The Transition to Low-Emission Sources
The U.S. has set a goal to reach 100% carbon pollution-free electricity by 2035.
Transitioning to low-emission energy sources like hydroelectricity, biomass, wind, and solar is essential for meeting U.S. climate goals.
In addition, clean energy stands out as the most significant job creator in America’s energy sector, with over 3 million Americans employed in clean energy jobs during 2021.
By embracing more renewables and nuclear power, U.S. utilities can reduce emissions and contribute to economic development.
Click here to learn more about how electric utilities and the power sector can lead on the path toward decarbonization.

-

 Electrification1 year ago
Visualized: How the Power Grid Works
-

 Energy Shift9 months ago
Ranked: The Cheapest Sources of Electricity in the U.S.
-

 Energy Shift1 year ago
Animated: 70 Years of U.S. Electricity Generation by Source
-

 Clean Energy1 year ago
Breaking Down Clean Energy Funding in the Inflation Reduction Act
-

 Clean Energy1 year ago
The 30 Largest U.S. Hydropower Plants
-

 Decarbonization1 year ago
The U.S. Utilities Decarbonization Index
-

 Clean Energy7 months ago
Breaking Down the $110 Trillion Cost of the Clean Energy Transition
-
 Climate1 year ago
Visualizing the State of Climate Change