
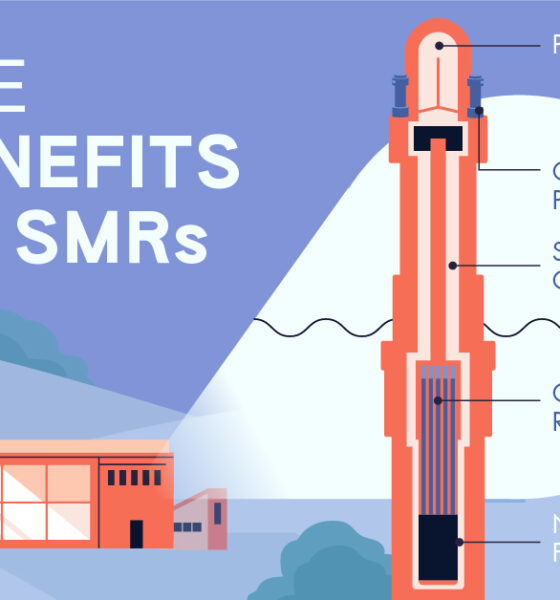
What advantages do small modular reactors offer compared to their traditional counterparts?

In this graphic, we explore the $3 trillion clean energy investment gap visualized by sector, according to BloombergNEF data.

Streamlining processes, investing in infrastructure, and promoting local manufacturing can pave the way for wind and solar adoption.
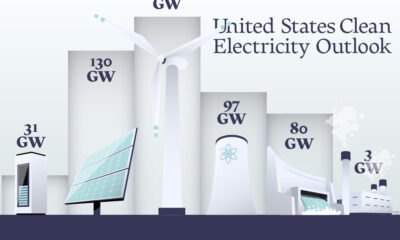

In this graphic, we explore the projected generation capacity of different clean electricity technologies in the U.S. for 2023 and 2024.
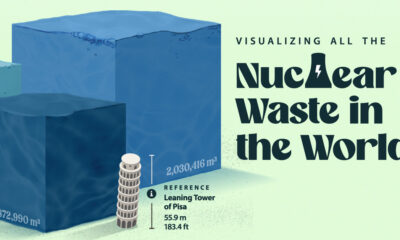

Despite concerns about nuclear waste, high-level radioactive waste constitutes less than 0.25% of all radioactive waste ever generated.
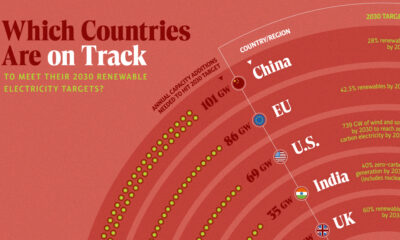

In this graphic, we visualize whether major electricity-consuming countries are on track to meet their 2030 renewable energy targets.


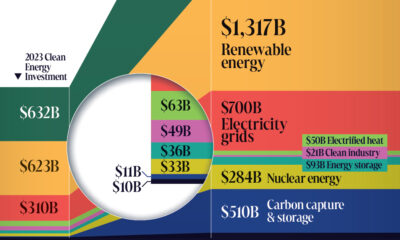
The clean energy transition will cost $110 trillion in global capital investments between 2021 and 2050. Here's that sum broken down by sector.
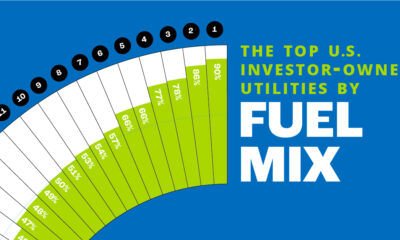

In this chart, we rank the top U.S. utilities by the share of low-carbon sources in their owned electricity generations.
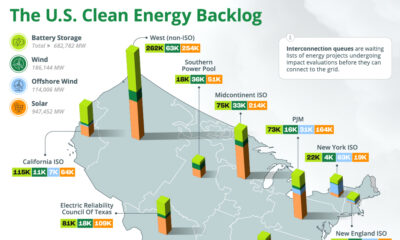

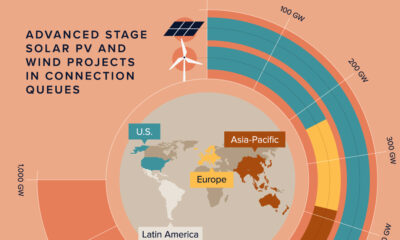
The U.S. has almost 2 million megawatts of clean energy capacity on hold in interconnection queues, seeking connection to the grid.
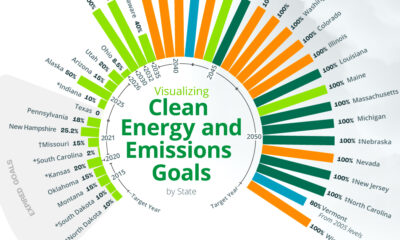

An overview of each U.S. state’s ultimate clean energy or GHG emission reduction goal, broken down by goal type and target year.
