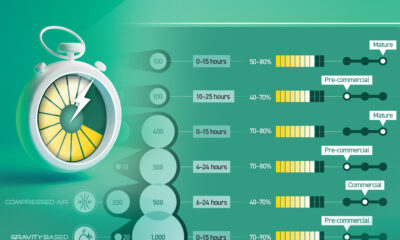

In this chart, we break down the parameters of LDES technologies that have commercial or pre-commercial readiness.
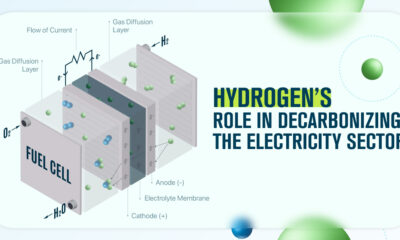

In this infographic, we discuss three ways hydrogen can support the decarbonization of the global electricity sector.
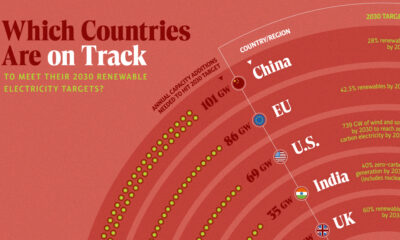

In this graphic, we visualize whether major electricity-consuming countries are on track to meet their 2030 renewable energy targets.
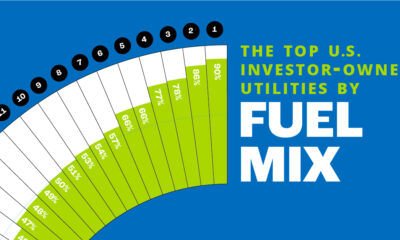

In this chart, we rank the top U.S. utilities by the share of low-carbon sources in their owned electricity generations.
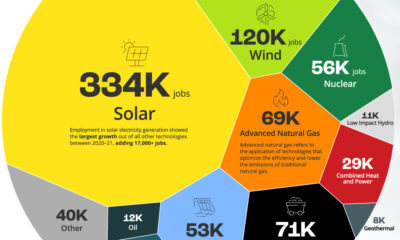

Exploring U.S. electricity generation jobs by technology with a focus on renewable energy and workforce development.
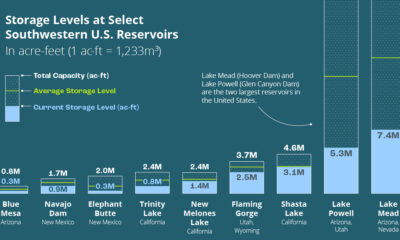

This infographic explores how droughts are affecting U.S. hydroelectric generation and the future of hydropower.
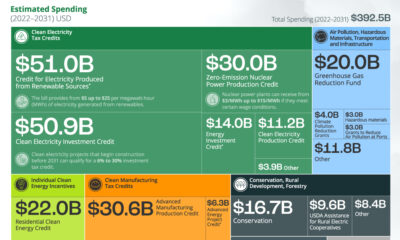

This graphic breaks down the $392.5 billion in clean energy funding in the Inflation Reduction Act of 2022.
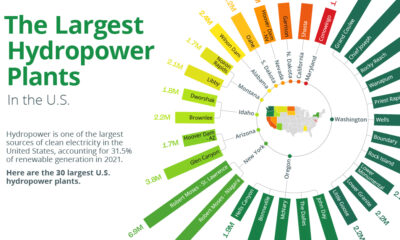

Hydropower accounts for one-third of U.S. renewable power generation. Here are the 30 largest U.S. hydropower plants.
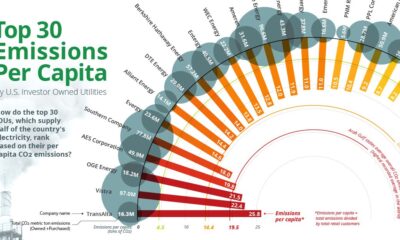

Emissions per Capita of the Top 30 U.S. Investor-Owned Utilities Approximately 25% of all U.S. greenhouse gas emissions (GHG) come from electricity generation. Subsequently, this means...