
Streamlining processes, investing in infrastructure, and promoting local manufacturing can pave the way for wind and solar adoption.
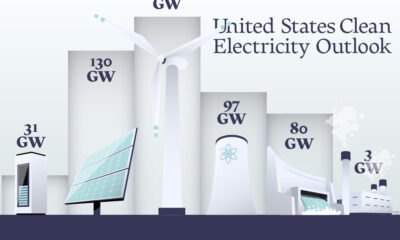

In this graphic, we explore the projected generation capacity of different clean electricity technologies in the U.S. for 2023 and 2024.
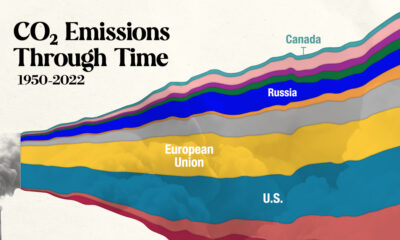

In this streamgraph, we break down global CO2 emissions between 1950 and 2022 using data from Berkeley Earth and Global Carbon Project.
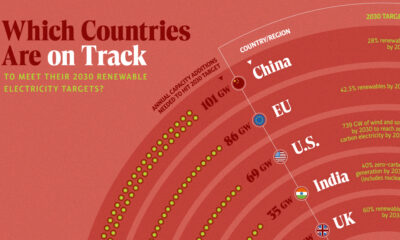

In this graphic, we visualize whether major electricity-consuming countries are on track to meet their 2030 renewable energy targets.
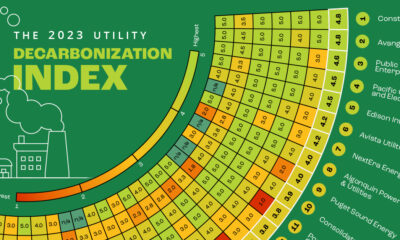

Here is a preview of our 2023 Utility Decarbonization Index, which tracks the decarbonization progress of the largest investor-owned utilities in America.
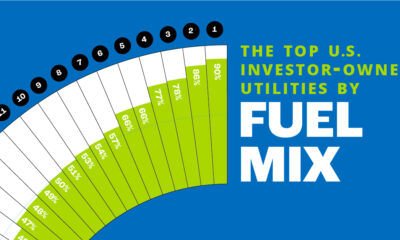

In this chart, we rank the top U.S. utilities by the share of low-carbon sources in their owned electricity generations.
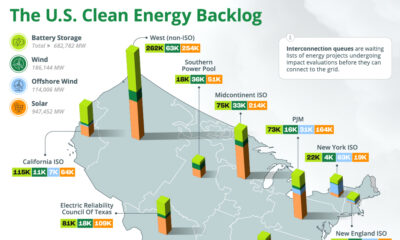

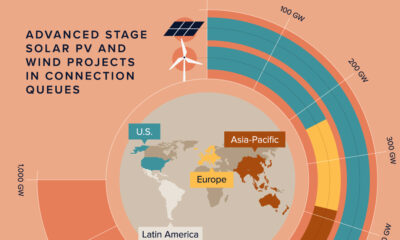
The U.S. has almost 2 million megawatts of clean energy capacity on hold in interconnection queues, seeking connection to the grid.
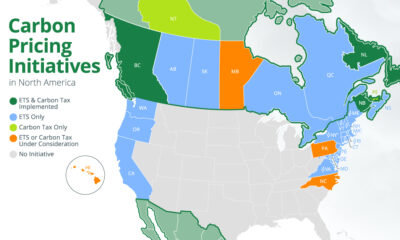

We map out all of the national and subnational carbon pricing initiatives in North America using data from the World Bank.
This infographic tracks the extent of electrification in the residential, commercial, industrial, and transportation sectors.
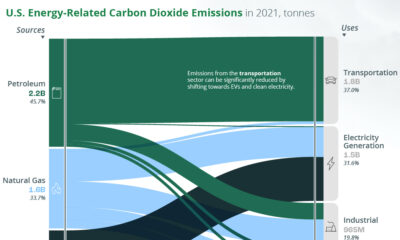

A look at the flow of energy-related CO2 emissions from the sources that generate energy to the sectors that use it.


