Energy Shift
All Commercially Available Long Duration Energy Storage Technologies, in One Chart
The following content is sponsored by the National Public Utilities Council
All Commercially Available Long Duration Energy Storage Technologies, in One Chart
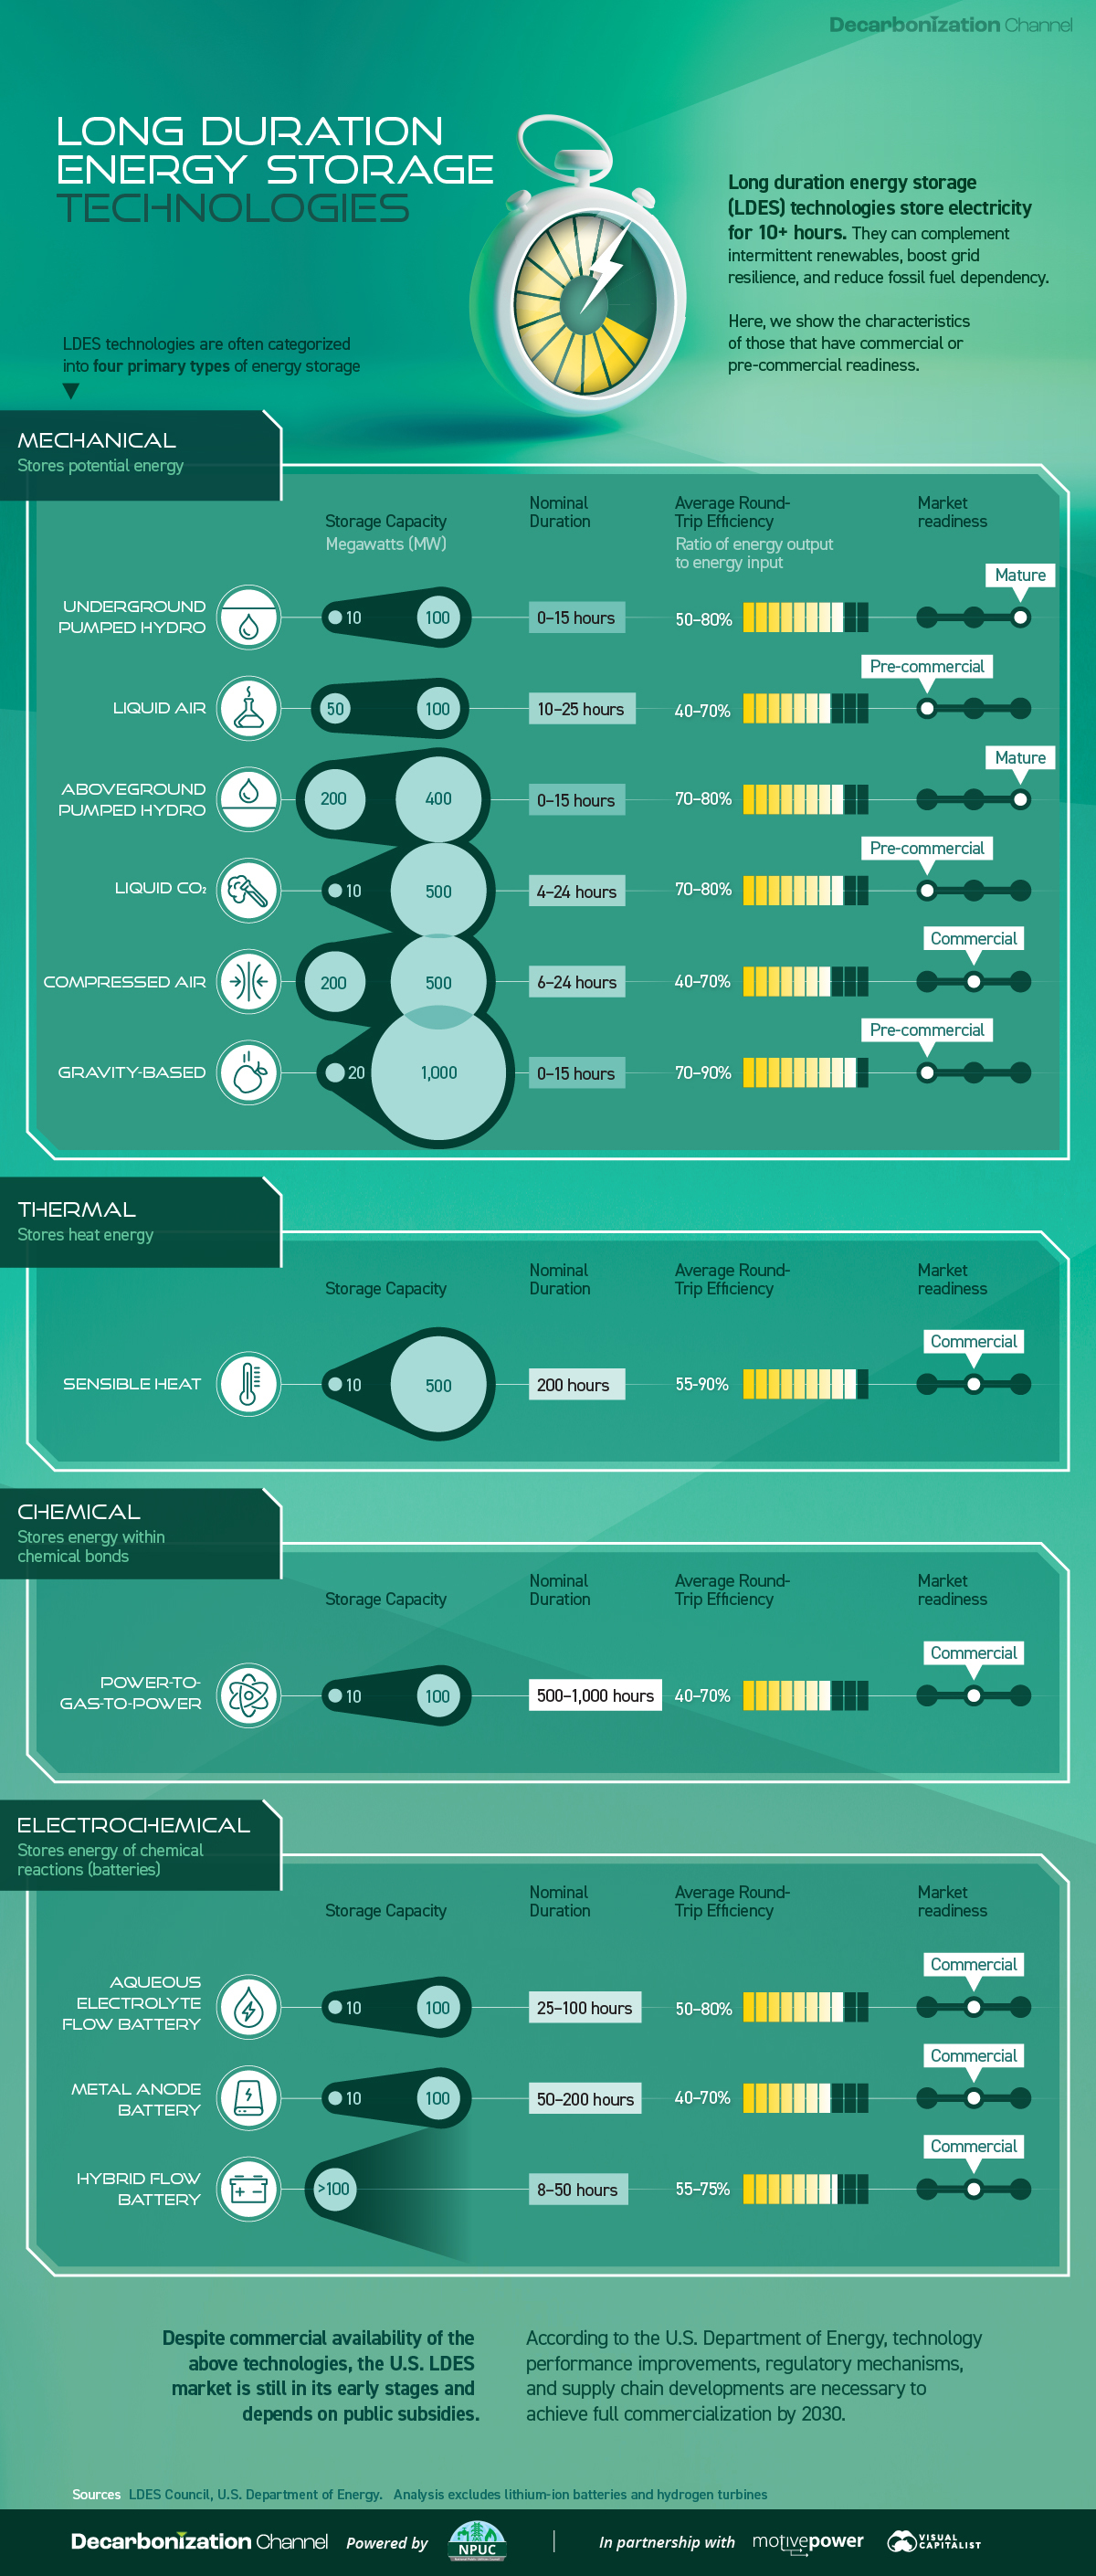
Long duration energy storage (LDES) technologies can store electricity for 10+ hours, complementing intermittent renewables, boosting grid resiliency, and reducing fossil fuel dependency.
Created in partnership with the National Public Utilities Council, this chart lists the characteristics of LDES technologies that have commercial or pre-commercial readiness, using data from the LDES Council’s Net-Zero Power report and 2023 deployment update.
The Four Primary Types of LDES
Before getting into the details, let’s cover the four primary types of LDES.
- Mechanical: Stores potential energy (by tension or position)
- Thermal: Stores energy as heat
- Chemical: Stores energy found within chemical bonds
- Electrochemical (batteries): Stores energy of chemical reactions, where electrical energy is converted to chemical energy and vice versa
Currently, mechanical storage systems are the most common around the world. Aboveground pumped hydropower, for instance, currently accounts for 96% of all utility-scale energy storage in the United States.
How Do LDES Technologies Measure Up?
Below, we list the storage capacity, storage duration, and average round-trip efficiency (RTE) of LDES technologies that have commercial or pre-commercial readiness on a global scale.
For context, RTE measures the effectiveness of a storage system by measuring the ratio of energy output to energy input during a full charge-discharge cycle. Or briefly, the higher the RTE, the lower the losses and therefore higher the efficiency.
| Form of Energy Storage | LDES Technology | Storage Capacity (MW) | Nominal Duration (Hours) | Average Round-Trip Efficiency |
|---|---|---|---|---|
| Mechanical | Underground pumped hydro | 10–100 | 0–15 | 50–80% |
| Mechanical | Liquid air | 50–100 | 10–25 | 40–70% |
| Mechanical | Aboveground pumped hydro | 200–400 | 0–15 | 70–80% |
| Mechanical | Liquid CO2 | 10–500 | 4–24 | 70–80% |
| Mechanical | Compressed air | 200–500 | 6–24 | 40–70% |
| Mechanical | Gravity-based | 20–1,000 | 0–15 | 70–90% |
| Thermal | Sensible heat | 10–500 | 200 | 55–90% |
| Chemical | Power-to-gas-to-power | 10–100 | 500–1,000 | 40–70% |
| Electrochemical | Aqueous electrolyte flow battery | 10–100 | 25–100 | 50–80% |
| Electrochemical | Metal anode battery | 10–100 | 50–200 | 40–70% |
| Electrochemical | Hybrid flow battery (with liquid electrolyte and metal anode) | >100 | 8–50 | 55–75% |
The table above shows that a mechanical, gravity-based LDES system can provide the highest storage capacity while presenting an impressive 70–90% average RTE.
On the other hand, a chemical power-to-gas-to-power system, which typically converts electricity to hydrogen gas and back to electricity, provides the highest storage duration of up to 1,000 hours.
With that said, there are different storage needs and siting considerations across electrical grids. Given the diverse range of options available, suitable solutions can be found to complement renewables and aid decarbonization.
Learn how the National Public Utilities Council is working toward the future of sustainable electricity.
Energy Shift
Mapped: The Age of Energy Projects in Interconnection Queues, by State
This map shows how many energy projects are in interconnection queues by state and how long these projects have been queued up, on average.
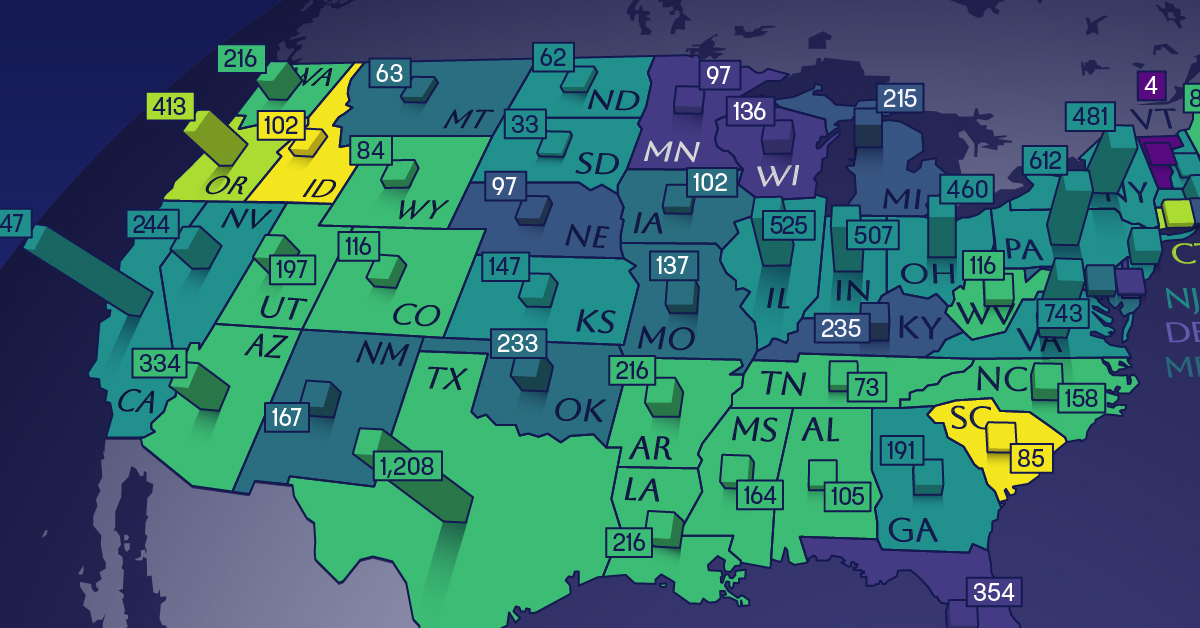
U.S. Energy Projects in Interconnection Queues, by State
By the end of 2023, more than 11,000 energy projects were in interconnection queues in the United States, waiting for a green-light from regional grid operators to proceed with construction.
This map, sponsored by the National Public Utilities Council, maps out the average age of active energy projects in interconnection queues by state, using data from Berkeley Lab.
Interconnection Queues, Explained
Interconnection queues are lists of energy projects that have made interconnection requests to their regional grid operators. Once submitted, these requests formally initiate the impact study process that each project goes through before grid connection, forming waiting lists for approval known as interconnection queues.
In recent years, both the number and generation capacity of queued projects have surged in the United States, along with the length of time spent in queue.
According to Berkeley Lab, the amount of generation capacity entering queues each year has risen by more than 550% from 2015 to 2023, with average queue duration rising from 3 years to 5 years the same period.
As a result of the growing backlog, a large proportion of projects ultimately withdraw from queues, leading to only 19% of applications reaching commercial operations.
The Backlog: Number of Projects and Average Wait Times
Of the 11,000 active projects in U.S. queues at the end of 2023, Texas, California, and Virginia had the most in queue; 1,208, 947, and 743, respectively.
When looking at the average ages of these projects, all three states hovered around the national average of 34 months (2.83 years), with Texas sporting 28 months, California 33, and Virginia 34.
Vermont, Minnesota, Wisconsin, and Florida, on the other hand, had the highest average queue durations; 54, 49, 47, and 46 months, respectively.
Average Queue Duration by Project Type
At the end of 2023, more than 95% of the generation capacity in active interconnection queues was for emission-free resources. The table below provides a breakdown.
| Project Type | Average Queue Duration (As of 12/31/2023) | Number of Projects in Queue |
|---|---|---|
| Wind | 40 months | 841 |
| Solar | 34 months | 4,506 |
| Wind+Battery | 34 months | 76 |
| Solar+Battery | 27 months | 2,377 |
| Battery | 24 months | 2,818 |
Wind projects had the highest wait times at the end of 2023 with an average age of 40 months (3.33 years). Solar projects, on the other hand, made up more than 40% of projects in queue.
Overall, reducing the time that these renewable energy projects spend in queues can accelerate the transition to a low-carbon energy future.
According to the U.S. Department of Energy, enhancing data transparency, streamlining approval processes, promoting economic efficiency, and maintaining a reliable grid are some of the ways this growing backlog can be mitigated.
Learn how the National Public Utilities Council is working toward the future of sustainable electricity.
Energy Shift
Visualized: The Evolution of Energy Employment (2022–2030P)
This graphic shows the projected evolution of global energy employment between 2022 and 2030 using data by the International Energy Agency.

The Evolution of Energy Employment (2022–2030P)
According to the International Energy Agency (IEA), just over half of the 67 million people employed in the global energy industry in 2022 worked in the clean energy sector: 35 million vs. 32 million in fossil fuels. And with the clean energy transition picking up pace, that gap is set to widen.
In this graphic created in partnership with the National Public Utilities Council, we explore how global energy employment could change by 2030 in a current policy scenario, using projections from the IEA.
The Rise in Clean Energy Employment
The IEA’s current policy scenario is a conservative projection for progress in line with the present trajectory of our energy system. It doesn’t assume that nations will reach their announced goals or that net zero will be achieved by 2050.
Even within this conservative scenario, the global energy sector is projected to have a net gain of 5.7 million jobs by 2030. Except for the 300,000 jobs added in the oil and gas supply industry, these jobs are all in clean energy.
In a more ambitious scenario, aligned with achieving net zero by 2050, the net gain in jobs is projected to nearly triple to 17 million.
| Changes in global energy employment 2022–2030P, millions of jobs | Current policies scenario | Net-zero emissions 2050 scenario |
|---|---|---|
| Coal supply | -1.4 | -2.8 |
| Internal combustion engine vehicles | -1.1 | -6.2 |
| Unabated fossil fuel electricity | -0.2 | -1.2 |
| Critical minerals | +0.2 | +0.7 |
| Oil and gas supply | +0.3 | -2.5 |
| Low-emissions fuels | +0.4 | +3.2 |
| End-use efficiency | +1.2 | +3.2 |
| Energy grids and storage | +1.4 | +3.8 |
| Low-emission electricity | +1.7 | +11 |
| Electric vehicles and batteries | +3.2 | +7.7 |
| Net job creation | +5.7 | +16.9 |
In both scenarios, the global energy industry is poised to create millions of new jobs in the coming years, with the job gains in the clean energy sector significantly outweighing the job losses in the fossil fuel industry.
A People-Centred Transition
With projected growth of this magnitude, the IEA emphasizes that policymakers and industry must support employee transitions from fossil fuels and address skill gaps in emerging industries through education and training.
According to the World Energy Employment report, continued efforts in these areas are crucial to prevent labor shortages and avoid delays in the clean energy transition.
Learn how the National Public Utilities Council is working toward the future of sustainable electricity.

-

 Electrification1 year ago
Visualized: How the Power Grid Works
-

 Energy Shift9 months ago
Ranked: The Cheapest Sources of Electricity in the U.S.
-

 Energy Shift1 year ago
Animated: 70 Years of U.S. Electricity Generation by Source
-

 Clean Energy1 year ago
Breaking Down Clean Energy Funding in the Inflation Reduction Act
-

 Emissions1 year ago
Visualizing Global Per Capita CO2 Emissions
-

 Decarbonization1 year ago
The U.S. Utilities Decarbonization Index
-

 Clean Energy1 year ago
The 30 Largest U.S. Hydropower Plants
-

 Clean Energy7 months ago
Breaking Down the $110 Trillion Cost of the Clean Energy Transition