

What advantages do small modular reactors offer compared to their traditional counterparts?
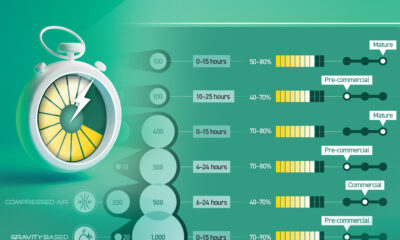

In this chart, we break down the parameters of LDES technologies that have commercial or pre-commercial readiness.
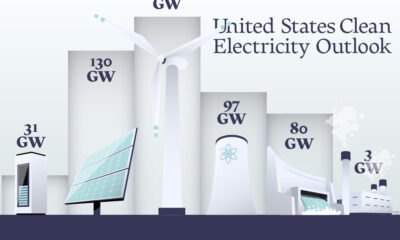

In this graphic, we explore the projected generation capacity of different clean electricity technologies in the U.S. for 2023 and 2024.
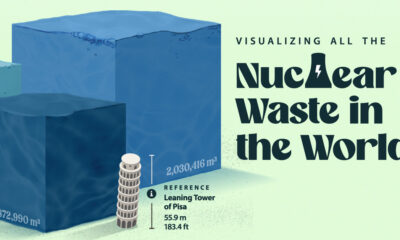

Despite concerns about nuclear waste, high-level radioactive waste constitutes less than 0.25% of all radioactive waste ever generated.


In this infographic, we discuss three ways hydrogen can support the decarbonization of the global electricity sector.
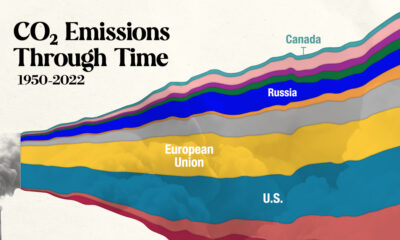

In this streamgraph, we break down global CO2 emissions between 1950 and 2022 using data from Berkeley Earth and Global Carbon Project.


In this set of three maps, we show the global temperature rise on a national level for 2022, 2050, and 2100 based on an analysis by...
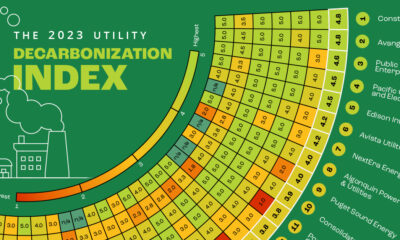

Here is a preview of our 2023 Utility Decarbonization Index, which tracks the decarbonization progress of the largest investor-owned utilities in America.
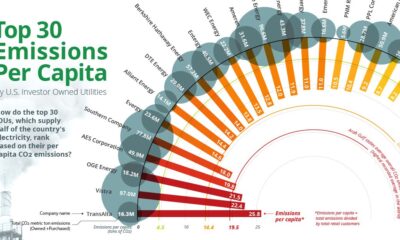

Emissions per Capita of the Top 30 U.S. Investor-Owned Utilities Approximately 25% of all U.S. greenhouse gas emissions (GHG) come from electricity generation. Subsequently, this means...
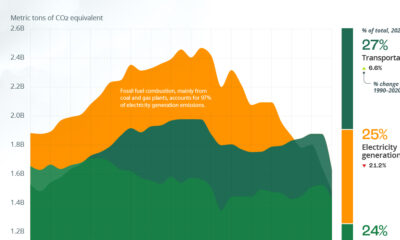

Visualizing U.S. Emissions by Sector Decarbonization efforts in the U.S. are ramping up, and in 2020, greenhouse gas (GHG) emissions were lower than at any point...


