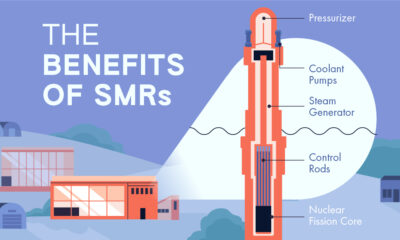

What advantages do small modular reactors offer compared to their traditional counterparts?
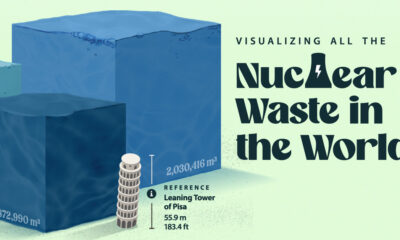

Despite concerns about nuclear waste, high-level radioactive waste constitutes less than 0.25% of all radioactive waste ever generated.
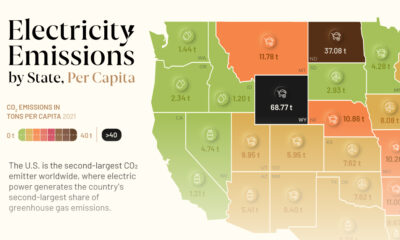

This graphic showcases electricity emissions by state, highlighting each state's largest source of power.
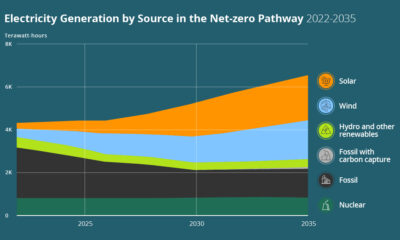

How can the U.S. achieve a 100% clean power sector? See the three key pillars of a decarbonized power sector in this infographic.
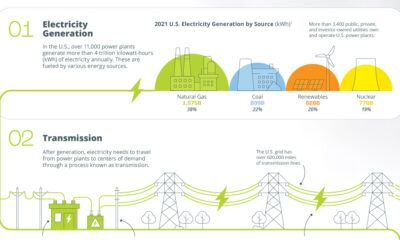

How does electricity get from the power plant to our homes? This infographic illustrates how the power grid works.
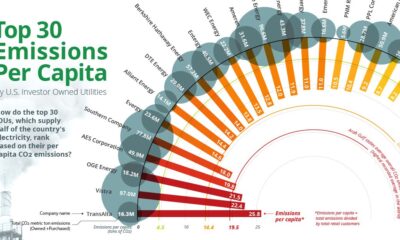

Emissions per Capita of the Top 30 U.S. Investor-Owned Utilities Approximately 25% of all U.S. greenhouse gas emissions (GHG) come from electricity generation. Subsequently, this means...
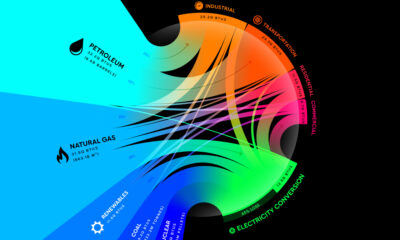

Breaking Down America’s Energy Consumption in 2020 This was originally published on July 6 2021, on Visual Capitalist. The United States relies on a complex mix...
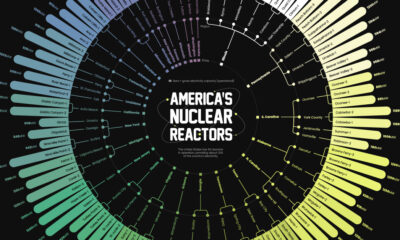

This infographic shows all of America's 92 nuclear reactors.
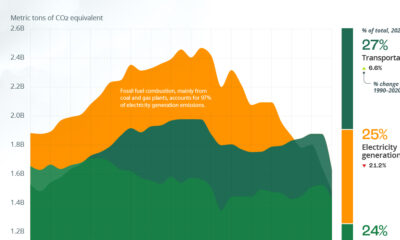

Visualizing U.S. Emissions by Sector Decarbonization efforts in the U.S. are ramping up, and in 2020, greenhouse gas (GHG) emissions were lower than at any point...