Energy Shift
Road to Decarbonization: U.S. Coal Plant Closures
The following content is sponsored by the National Public Utilities Council
Road to Decarbonization: U.S. Coal Plant Closures
This was originally posted on August 17, 2021, on Visual Capitalist.
As the push to decarbonize starts to kick into gear in the U.S., how do coal plant closures factor into the equation?
With a target of net-zero emissions by 2050, the U.S. is examining all aspects of its economy to see where action is needed. In the automotive industry, for example, the Biden administration is aiming for half of new vehicles to be electric by 2030, following in the footsteps of automakers that have made similar commitments.
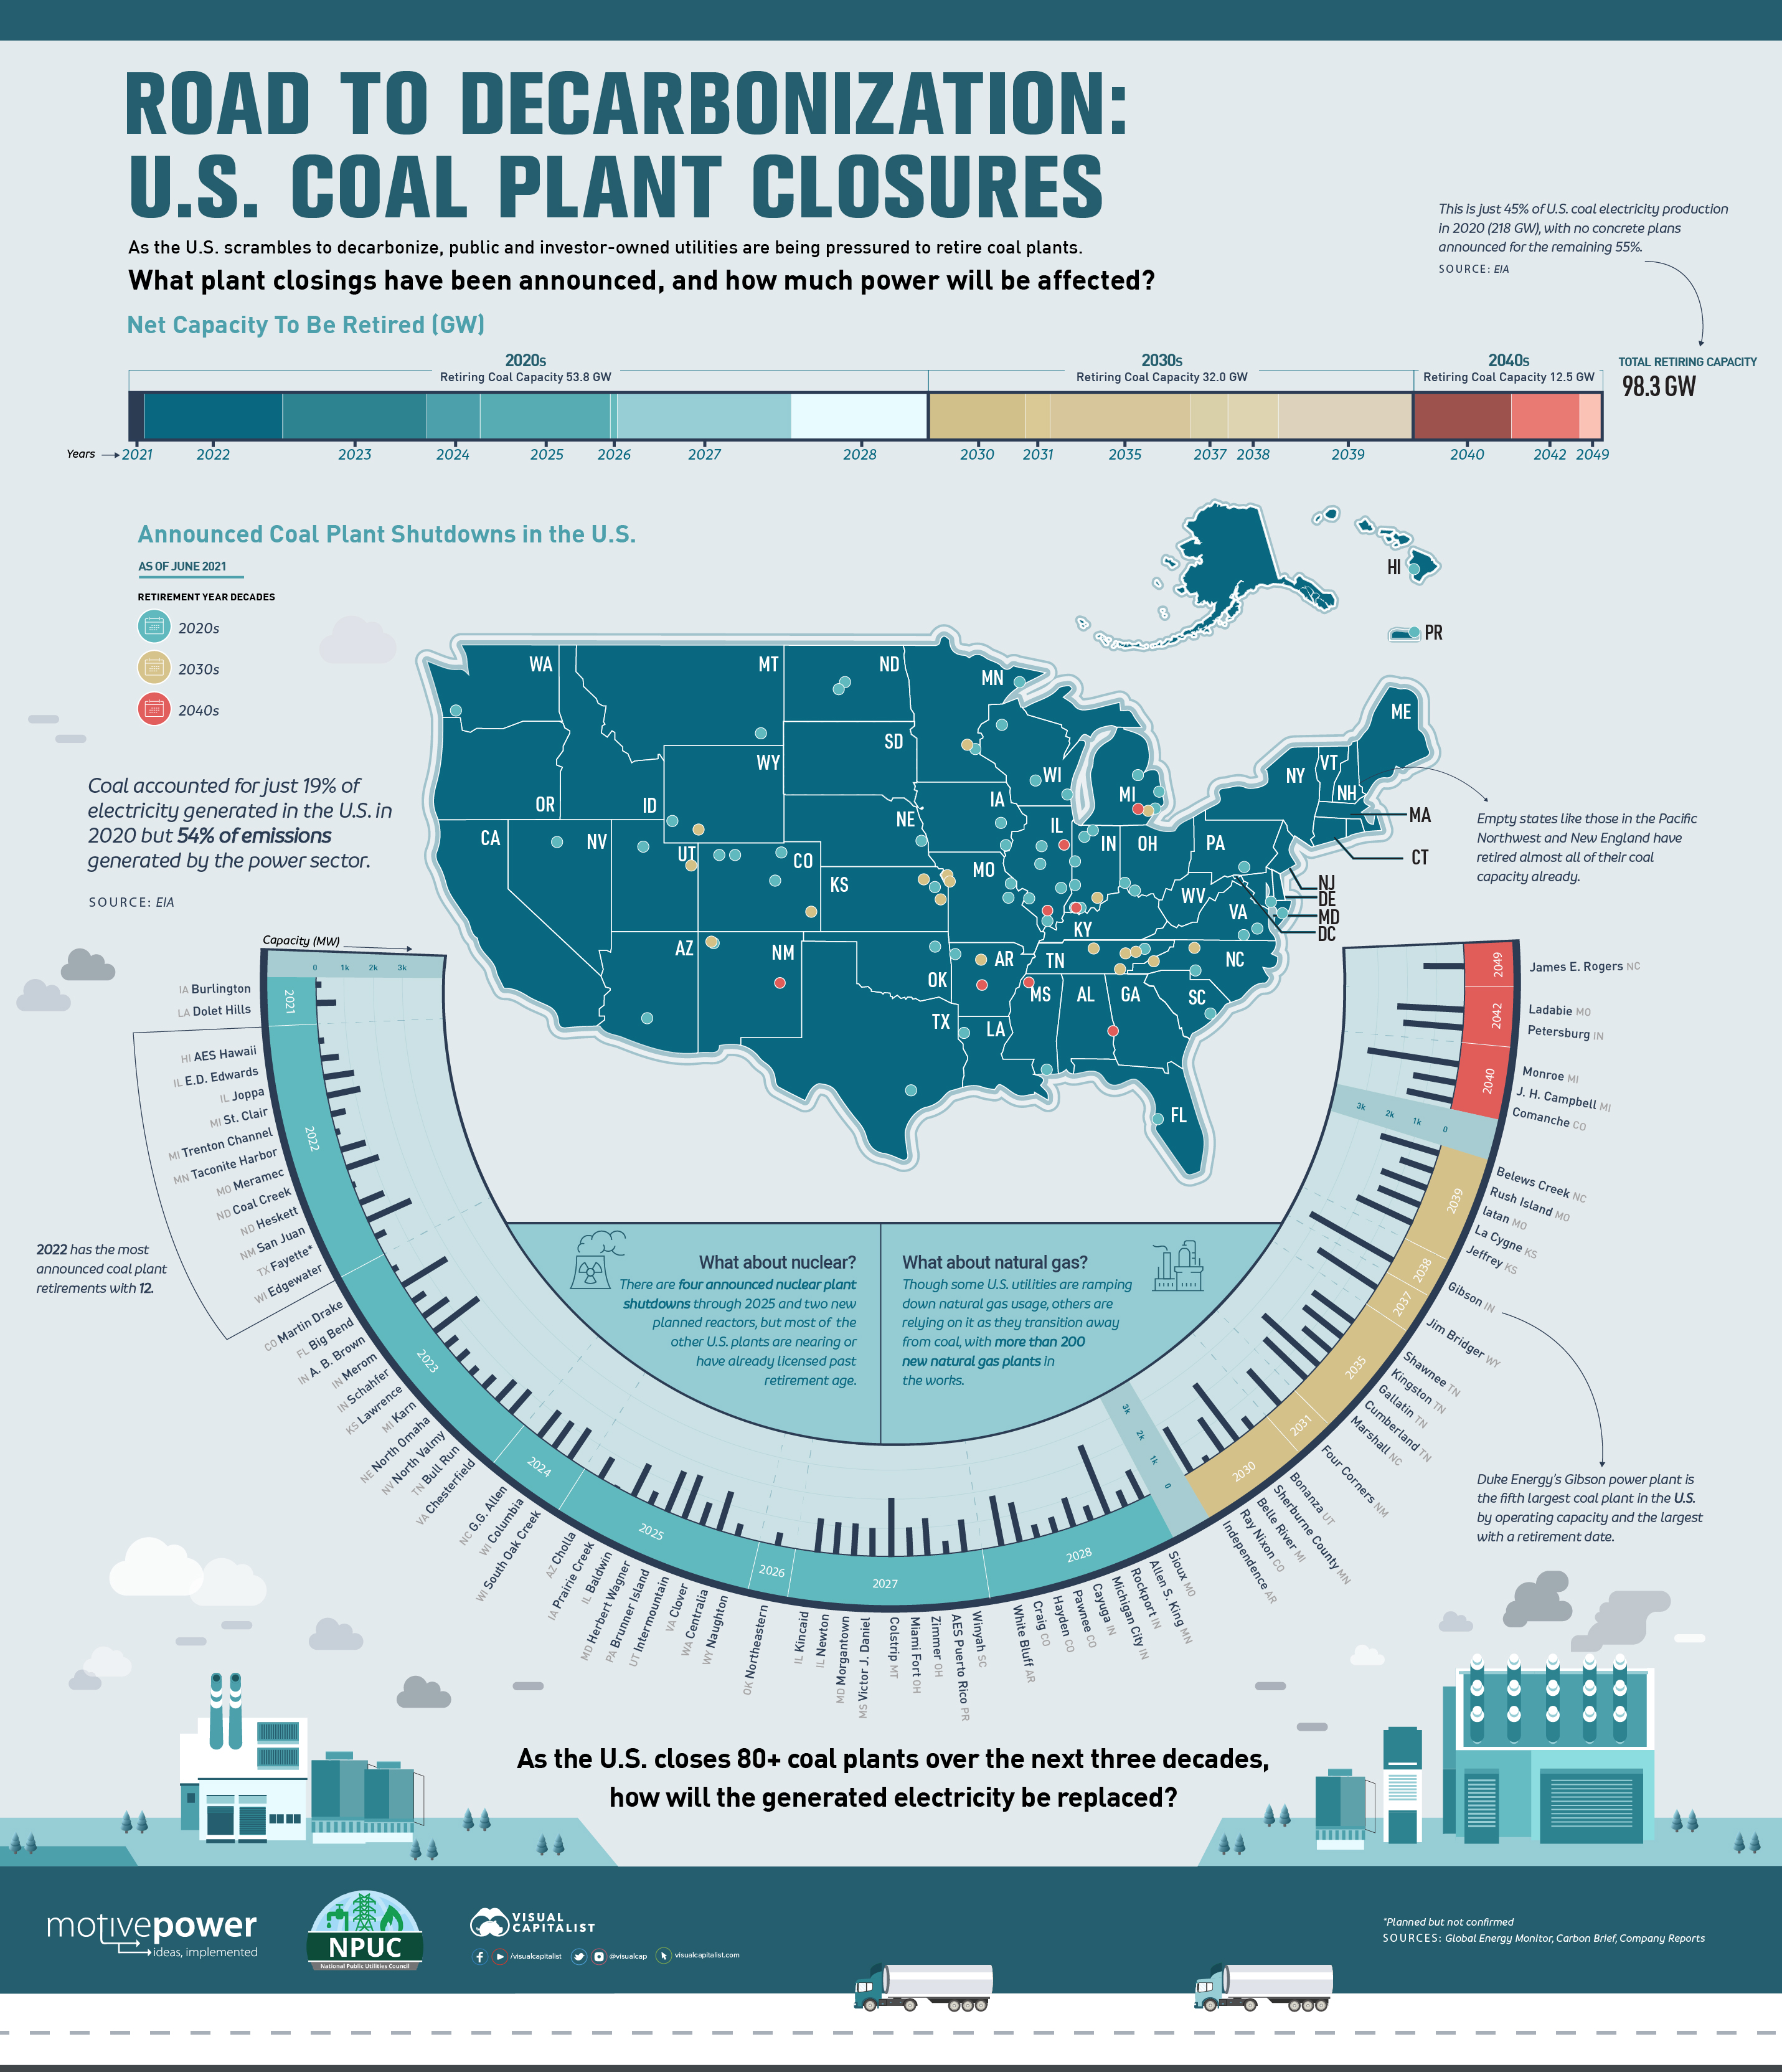
But in the power sector that supplies electricity for much of the country, fossil fuels continue to be large emission sources. Coal, which accounted for just 19% of electricity generated in the U.S. in 2020, created 54% of the power sector’s emissions.
That’s leading to U.S. utilities feeling the pressure to retire coal plants and look for alternatives. This infographic from the National Public Utilities Council visualizes the coal plant closures that have been announced, and how much power will be affected as a result.
Where Are U.S. Coal Plant Closures Happening?
Accurately tracking coal plant closures currently means turning to non-profits and parsing through company reports. To assemble this list, we leveraged the Global Energy Monitor and Carbon Brief and cross-referenced against company sustainability reports and news releases.
The result? 80 coal plants with a total capacity of 98.3 GW publicly scheduled for full retirement over the next three decades.
| Plant | State | Retirement Date | Capacity (MW) |
|---|---|---|---|
| Burlington | IA | 2021 | 212 |
| Dolet Hills | LA | 2021 | 721 |
| AES Hawaii | HI | 2022 | 204 |
| Coal Creek | ND | 2022 | 1,210 |
| E.D. Edwards | IL | 2022 | 645 |
| Edgewater | WI | 2022 | 414 |
| Fayette* (announced not confirmed) | TX | 2022 | 1,690 |
| Heskett | ND | 2022 | 115 |
| Joppa | IL | 2022 | 1,100 |
| Meramec | MO | 2022 | 924 |
| San Juan | NM | 2022 | 924 |
| St. Clair | MI | 2022 | 1,210 |
| Taconite Harbor | MN | 2022 | 168 |
| Trenton Channel | MI | 2022 | 536 |
| A.B. Brown | IN | 2023 | 530 |
| Big Bend | FL | 2023 | 1,824 |
| Bull Run | TN | 2023 | 950 |
| Chesterfield | VA | 2023 | 1,053 |
| Karn | MI | 2023 | 516 |
| Lawrence | KS | 2023 | 517 |
| Martin Drake | CO | 2023 | 207 |
| Merom | IN | 2023 | 1,080 |
| North Omaha | NE | 2023 | 354 |
| North Valmy | NV | 2023 | 567 |
| Schahfer | IN | 2023 | 1,944 |
| Columbia | WI | 2024 | 1,112 |
| G.G. Allen | NC | 2024 | 1,155 |
| South Oak Creek | WI | 2024 | 1,240 |
| Baldwin | IL | 2025 | 1,260 |
| Brunner Island | PA | 2025 | 1,558 |
| Centralia | WA | 2025 | 1,460 |
| Cholla | AZ | 2025 | 840 |
| Clover | VA | 2025 | 848 |
| Herbert Wagner | MD | 2025 | 495 |
| Intermountain | UT | 2025 | 1,640 |
| Nauhgton | WY | 2025 | 448 |
| Prairie Creek | IA | 2025 | 50 |
| Northeastern | OK | 2026 | 473 |
| AES Puerto Rico | PR | 2027 | 510 |
| Colstrip | MT | 2027 | 2,272 |
| Kincaid | IL | 2027 | 1,319 |
| Miami Fort | OH | 2027 | 1,115 |
| Morgantown | MD | 2027 | 1,252 |
| Newton | IL | 2027 | 1,235 |
| Victor J. Daniel | MS | 2027 | 1,097 |
| Winyah | SC | 2027 | 1,260 |
| Zimmer | OH | 2027 | 1,426 |
| Allen S. King | MN | 2028 | 598 |
| Cayuga | IN | 2028 | 1,062 |
| Craig | CO | 2028 | 1,427 |
| Hayden | CO | 2028 | 466 |
| Michigan City | IN | 2028 | 540 |
| Pawnee | CO | 2028 | 552 |
| Rockport | IN | 2028 | 2,600 |
| Sioux | MO | 2028 | 1,099 |
| White Bluff | AR | 2028 | 1,800 |
| Belle River | MI | 2030 | 1,396 |
| Bonanza | UT | 2030 | 500 |
| Independence | AR | 2030 | 1,800 |
| Ray Nixon | CO | 2030 | 207 |
| Sherburne County | MN | 2030 | 2,469 |
| Four Corners | NM | 2031 | 1,636 |
| Cumberland | TN | 2035 | 2,600 |
| Gallatin | TN | 2035 | 1,255 |
| Kingston | TN | 2035 | 1,700 |
| Marshall | NC | 2035 | 1,996 |
| Shawnee | TN | 2035 | 1,750 |
| Jim Bridger | WY | 2037 | 2,441 |
| Gibson | IN | 2038 | 3,340 |
| Belews Creek | NC | 2039 | 2,160 |
| Iatan | MO | 2039 | 1,725 |
| Jeffrey | KS | 2039 | 2,160 |
| La Cygne | KS | 2039 | 1,599 |
| Rush Island | MO | 2039 | 1,242 |
| Comanche | CO | 2040 | 1,636 |
| J. H. Campbell | MI | 2040 | 1,540 |
| Monroe | MI | 2040 | 3,280 |
| Ladabie | MO | 2042 | 2,389 |
| Petersburg | IN | 2042 | 2,147 |
| James E. Rogers | NC | 2049 | 1,481 |
Noticeably, most of the coal plant closures are targeted in the Midwest (which uses the most coal for power). And most of the retirements are coming early, with the 2020s seeing more than half of announced closures and retired capacity (53.6 GW).
But the largest coal plants with announced retirement dates are currently scheduled for the 2030s and 2040s. That includes Duke Energy’s Gibson power plant in Indiana, the fifth largest coal plant in the U.S. and the largest with a retirement date.
What’s Next for U.S. Decarbonization?
Though it seems like the U.S. has a lot of coal plant closures announced, there’s a lot left to go.
The 98.3 GW of tracked coal plant closures is just 45% of U.S. coal electricity production in 2020. Though many utilities have talked about eventually assessing and planning retirements for some of the remaining 55%, no concrete plans have been announced yet.
“In our industry, deciding to exit coal-fired power is not taken lightly,” said Omaya Ahmad, Sustainability Policy Consultant at Arizona Public Service. “Our coal plants are often the oldest in our fleet and are largely the reason our service territories have grown and flourished into what they are today. However, the pressures presented by climate change and the economic demands tied to coal have required a commitment to transition to clean energy.”
Coal Plant Closures Are Part of a Larger Equation
But as Ahmad explains, turning off coal plants is not such a quick-and-easy fix.
“Such a transition will be a lofty undertaking and will not come without its own challenges,” said Ahmad. “Recognizing the regional transition landscape and timeline depicted on a map like this one will help utilities adequately prepare for and support their coal communities as we all take steps to reach a clean energy economy.”
And coal plants are just one part of the decarbonization equation. Some utilities are opting to transform coal power plants into natural gas plants, which are more cost-efficient and emit less than coal. Even though many utilities and consumers are turning away from carbon emitting fuel sources entirely, there are more than 200 new natural gas plants planned in the U.S.
But the big question is how the generated electricity from coal will be replaced. Communities that rely on coal for power (and economic strength) will have to turn to natural gas or work on renewables capacity, while others have already started the transition.
National Public Utilities Council is the go-to resource for all things decarbonization in the utilities industry. Learn more.
Energy Shift
All Commercially Available Long Duration Energy Storage Technologies, in One Chart
In this chart, we break down the parameters of LDES technologies that have commercial or pre-commercial readiness.

All Commercially Available Long Duration Energy Storage Technologies, in One Chart
Long duration energy storage (LDES) technologies can store electricity for 10+ hours, complementing intermittent renewables, boosting grid resiliency, and reducing fossil fuel dependency.
Created in partnership with the National Public Utilities Council, this chart lists the characteristics of LDES technologies that have commercial or pre-commercial readiness, using data from the LDES Council’s Net-Zero Power report and 2023 deployment update.
The Four Primary Types of LDES
Before getting into the details, let’s cover the four primary types of LDES.
- Mechanical: Stores potential energy (by tension or position)
- Thermal: Stores energy as heat
- Chemical: Stores energy found within chemical bonds
- Electrochemical (batteries): Stores energy of chemical reactions, where electrical energy is converted to chemical energy and vice versa
Currently, mechanical storage systems are the most common around the world. Aboveground pumped hydropower, for instance, currently accounts for 96% of all utility-scale energy storage in the United States.
How Do LDES Technologies Measure Up?
Below, we list the storage capacity, storage duration, and average round-trip efficiency (RTE) of LDES technologies that have commercial or pre-commercial readiness on a global scale.
For context, RTE measures the effectiveness of a storage system by measuring the ratio of energy output to energy input during a full charge-discharge cycle. Or briefly, the higher the RTE, the lower the losses and therefore higher the efficiency.
| Form of Energy Storage | LDES Technology | Storage Capacity (MW) | Nominal Duration (Hours) | Average Round-Trip Efficiency |
|---|---|---|---|---|
| Mechanical | Underground pumped hydro | 10–100 | 0–15 | 50–80% |
| Mechanical | Liquid air | 50–100 | 10–25 | 40–70% |
| Mechanical | Aboveground pumped hydro | 200–400 | 0–15 | 70–80% |
| Mechanical | Liquid CO2 | 10–500 | 4–24 | 70–80% |
| Mechanical | Compressed air | 200–500 | 6–24 | 40–70% |
| Mechanical | Gravity-based | 20–1,000 | 0–15 | 70–90% |
| Thermal | Sensible heat | 10–500 | 200 | 55–90% |
| Chemical | Power-to-gas-to-power | 10–100 | 500–1,000 | 40–70% |
| Electrochemical | Aqueous electrolyte flow battery | 10–100 | 25–100 | 50–80% |
| Electrochemical | Metal anode battery | 10–100 | 50–200 | 40–70% |
| Electrochemical | Hybrid flow battery (with liquid electrolyte and metal anode) | >100 | 8–50 | 55–75% |
The table above shows that a mechanical, gravity-based LDES system can provide the highest storage capacity while presenting an impressive 70–90% average RTE.
On the other hand, a chemical power-to-gas-to-power system, which typically converts electricity to hydrogen gas and back to electricity, provides the highest storage duration of up to 1,000 hours.
With that said, there are different storage needs and siting considerations across electrical grids. Given the diverse range of options available, suitable solutions can be found to complement renewables and aid decarbonization.
Learn how the National Public Utilities Council is working toward the future of sustainable electricity.
Energy Shift
Visualized: The Evolution of Energy Employment (2022–2030P)
This graphic shows the projected evolution of global energy employment between 2022 and 2030 using data by the International Energy Agency.

The Evolution of Energy Employment (2022–2030P)
According to the International Energy Agency (IEA), just over half of the 67 million people employed in the global energy industry in 2022 worked in the clean energy sector: 35 million vs. 32 million in fossil fuels. And with the clean energy transition picking up pace, that gap is set to widen.
In this graphic created in partnership with the National Public Utilities Council, we explore how global energy employment could change by 2030 in a current policy scenario, using projections from the IEA.
The Rise in Clean Energy Employment
The IEA’s current policy scenario is a conservative projection for progress in line with the present trajectory of our energy system. It doesn’t assume that nations will reach their announced goals or that net zero will be achieved by 2050.
Even within this conservative scenario, the global energy sector is projected to have a net gain of 5.7 million jobs by 2030. Except for the 300,000 jobs added in the oil and gas supply industry, these jobs are all in clean energy.
In a more ambitious scenario, aligned with achieving net zero by 2050, the net gain in jobs is projected to nearly triple to 17 million.
| Changes in global energy employment 2022–2030P, millions of jobs | Current policies scenario | Net-zero emissions 2050 scenario |
|---|---|---|
| Coal supply | -1.4 | -2.8 |
| Internal combustion engine vehicles | -1.1 | -6.2 |
| Unabated fossil fuel electricity | -0.2 | -1.2 |
| Critical minerals | +0.2 | +0.7 |
| Oil and gas supply | +0.3 | -2.5 |
| Low-emissions fuels | +0.4 | +3.2 |
| End-use efficiency | +1.2 | +3.2 |
| Energy grids and storage | +1.4 | +3.8 |
| Low-emission electricity | +1.7 | +11 |
| Electric vehicles and batteries | +3.2 | +7.7 |
| Net job creation | +5.7 | +16.9 |
In both scenarios, the global energy industry is poised to create millions of new jobs in the coming years, with the job gains in the clean energy sector significantly outweighing the job losses in the fossil fuel industry.
A People-Centred Transition
With projected growth of this magnitude, the IEA emphasizes that policymakers and industry must support employee transitions from fossil fuels and address skill gaps in emerging industries through education and training.
According to the World Energy Employment report, continued efforts in these areas are crucial to prevent labor shortages and avoid delays in the clean energy transition.
Learn how the National Public Utilities Council is working toward the future of sustainable electricity.

-

 Electrification1 year ago
Visualized: How the Power Grid Works
-

 Energy Shift9 months ago
Ranked: The Cheapest Sources of Electricity in the U.S.
-

 Energy Shift1 year ago
Animated: 70 Years of U.S. Electricity Generation by Source
-

 Clean Energy1 year ago
Breaking Down Clean Energy Funding in the Inflation Reduction Act
-

 Emissions1 year ago
Visualizing Global Per Capita CO2 Emissions
-

 Clean Energy1 year ago
The 30 Largest U.S. Hydropower Plants
-

 Decarbonization1 year ago
The U.S. Utilities Decarbonization Index
-

 Clean Energy7 months ago
Breaking Down the $110 Trillion Cost of the Clean Energy Transition