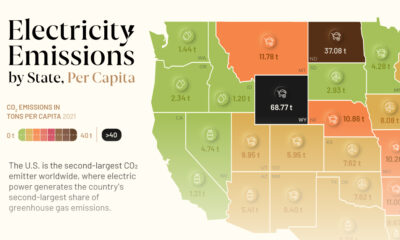

This graphic showcases electricity emissions by state, highlighting each state's largest source of power.


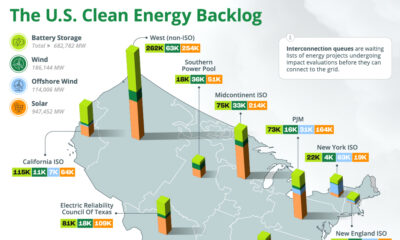
The U.S. has almost 2 million megawatts of clean energy capacity on hold in interconnection queues, seeking connection to the grid.


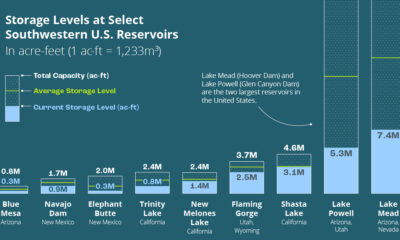
This infographic explores how droughts are affecting U.S. hydroelectric generation and the future of hydropower.


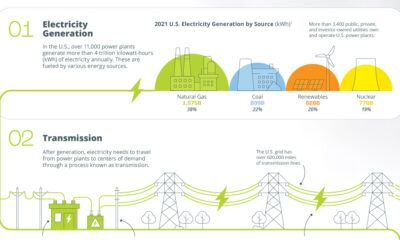
How does electricity get from the power plant to our homes? This infographic illustrates how the power grid works.