Energy
Visualizing U.S. Electricity Generation Jobs by Technology
The following content is sponsored by the National Public Utilities Council
Visualizing U.S. Electricity Generation Jobs by Technology
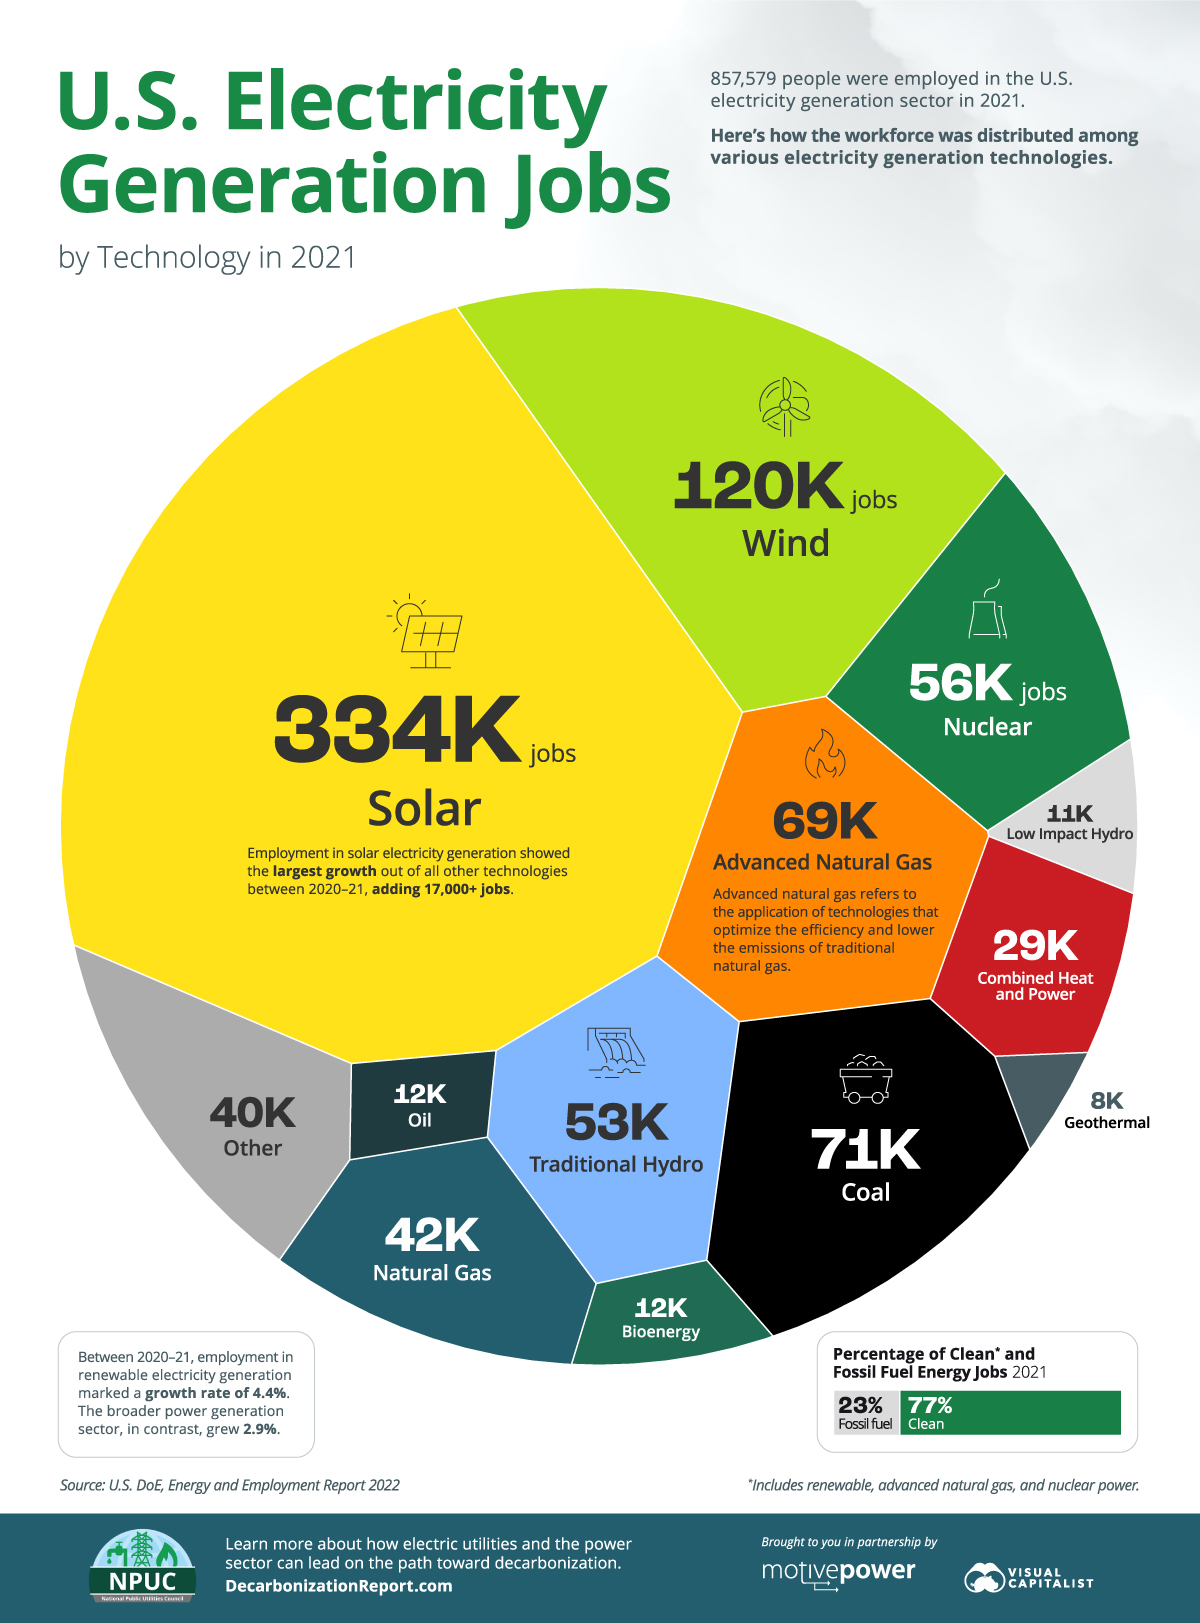
In 2021, 857,579 people were employed in the U.S. electricity generation sector.
To explore the distribution of this workforce, the above graphic by the National Public Utilities Council breaks down the number of jobs for each electricity generation technology using the U.S. Department of Energy’s Energy and Employment Report.
An Evolving Employment Landscape
The employment landscape within the U.S. electricity generation sector is continually evolving, driven by technological shifts, growing urgency towards decarbonization, and new policy initiatives.
Here are some interesting trends seen in 2021.
1. Solar Leads the Way with Significant Job Growth
The solar energy sector emerged as a shining star in 2021, witnessing substantial job growth compared to other electricity generation technologies. With a total of 333,887 jobs, solar not only topped the chart but also experienced a notable increase of over 17,000 jobs from the previous year.
This surge in solar jobs can be attributed to several factors, including advancements in technology, falling costs, and increased adoption of renewable energy sources across the country.
2. Advanced Natural Gas Employs More People Than Traditional
While renewable energy sources gained traction, advanced natural gas also played a significant role in the U.S. electricity generation sector with 69,113 jobs.
Advanced natural gas refers to the application of technologies that optimize efficiency and reduce the emissions associated with traditional natural gas.
As the fourth biggest employer on the list, advanced natural gas employed more people than traditional natural gas in 2021.
3. Renewable Energy Sector Outpaces Broader Sector Growth
Between 2020 and 2021, the renewable electricity generation sector experienced a robust growth rate of 4.4% in employment, outpacing the broader power generation sector’s growth rate of 2.9%.
The employment figures highlight the potential for continued job creation within the renewable sector as the transition to cleaner energy sources gains further momentum.
Getting Over the Workforce Development Hurdle
The employment figures in the U.S. electricity generation sector demonstrate promising growth in clean energy jobs. With that said, rapid decarbonization of the sector may still require a level of workforce development that hasn’t yet been seen in the United States.
As electric utilities and the nation at large strive to achieve their ambitious net-zero goals, investing more in workforce development can be an integral piece of the puzzle, specifically to help individuals transition smoothly from fossil fuel jobs to those in clean generation.
By addressing this challenge, the U.S. can ensure a well-prepared workforce that will drive the transition to a sustainable and net-zero future.
Energy
How Does U.S. Electricity Generation Change Over One Week?
This chart tracks U.S. hourly electricity generation over one week, with various sources producing electricity at different times of the day.
How Does U.S. Electricity Generation Change in a Week?
The U.S. has a dynamic electricity mix, with a range of energy sources generating electricity at different times of the day.
At all times, the amount of electricity generated must match demand in order to keep the power grid in balance, which leads to cyclical patterns in daily and weekly electricity generation.
The above graphic sponsored by the National Public Utilities Council tracks hourly changes in U.S. electricity generation over one week, based on data from the U.S. Energy Information Administration (EIA).
The Three Types of Power Plants
Before diving in, it’s important to distinguish between the three main types of power plants in the U.S. electricity mix:
- Base load plants generally run at full or near-full capacity and are used to meet the base load or the minimum amount of electricity demanded at all times. These are typically coal-fired or nuclear power plants. If regionally available, geothermal and hydropower plants can also be used as baseload sources.
- Peak load or peaking power plants are typically dispatchable and can be ramped up quickly during periods of high demand. These plants usually operate at maximum capacity only for a few hours a day and include gas-fired and pumped-storage hydropower plants.
- Intermediate load plants are used during the transitory hours between base load and peak load demand. Intermittent renewable sources like wind and solar (without battery storage) are suitable for intermediate use, along with other sources.
Zooming In: The U.S. Hourly Electricity Mix
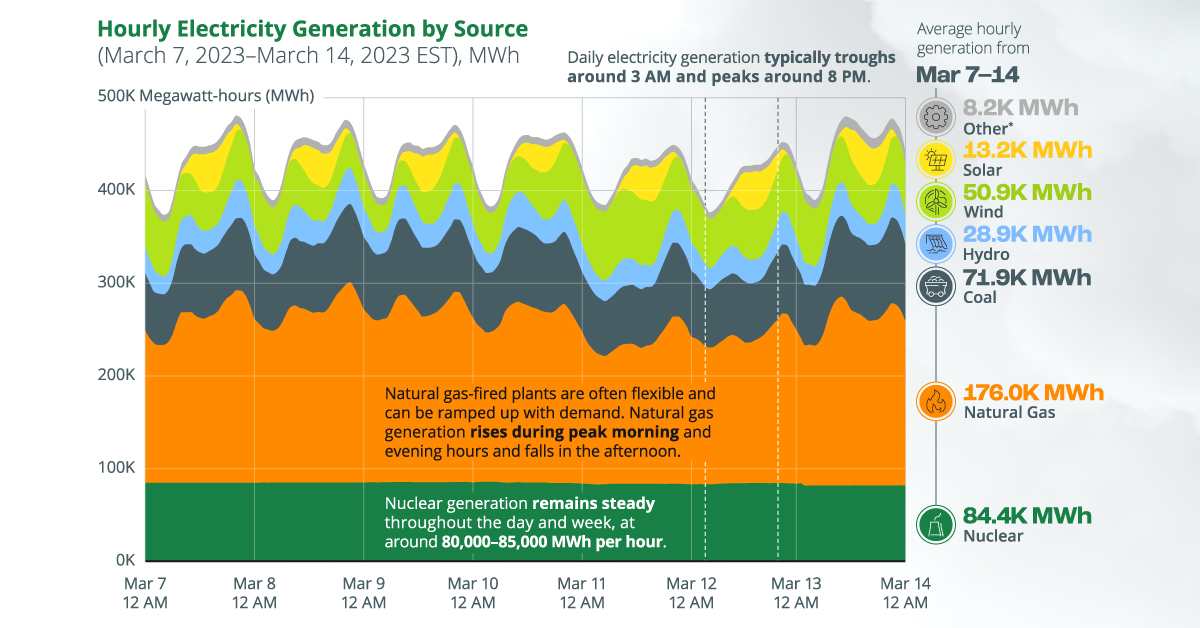
With that context, the table below provides an overview of average hourly electricity generation by source for the week of March 7–March 14, 2023, in the Eastern Time Zone.
It’s worth noting that while this is representative of a typical week of electricity generation, these patterns can change with seasons. For example, in the month of June, electricity demand usually peaks around 5 PM, when solar generation is still high, unlike in March.
| Energy Source | Type | Avg. Hourly Electricity Generation, MWh (Mar 07–14, 2023, EST) |
|---|---|---|
| Natural Gas | Fossil fuel | 175,967 |
| Nuclear | Non-renewable | 84,391 |
| Coal | Fossil fuel | 71,922 |
| Wind | Renewable | 50,942 |
| Hydro | Renewable | 28,889 |
| Solar | Renewable | 13,213 |
| Other | Mixed | 8,192 |
Natural gas is the country’s largest source of electricity, with gas-fired plants generating an average of 176,000 MWh of electricity per hour throughout the week outlined above. The dispatchable nature of natural gas is evident in the chart, with gas-fired generation falling in the wee hours and rising during business hours.
Meanwhile, nuclear electricity generation remains steady throughout the given days and week, ranging between 80,000–85,000 MWh per hour. Nuclear plants are designed to operate for long durations (1.5 to 2 years) before refueling and require less maintenance, allowing them to provide reliable baseload energy.
On the other hand, wind and solar generation tend to see large fluctuations throughout the week. For example, during the week of March 07–14, wind generation ranged between 26,875 MWh and 77,185 MWh per hour, based on wind speeds. Solar generation had stronger extremes, often reaching zero or net-negative at night and rising to over 40,000 MWh in the afternoon.
Because wind and solar are often variable and location-specific, integrating them into the grid can pose challenges for grid operators, who rely on forecasts to keep electricity supply and demand in balance. So, what are some ways to solve these problems?
Solving the Renewable Intermittency Challenge
As more renewable capacity is deployed, here are three ways to make the transition smoother.
- Energy storage systems can be combined with renewables to mitigate variability. Batteries can store electricity during times of high generation (for example, in the afternoon for solar), and supply it during periods of peak demand.
- Demand-side management can be used to shift flexible demand to times of high renewable generation. For instance, utilities can collaborate with their industrial customers to ensure that certain factory lines only run in the afternoon, when solar generation peaks.
- Expanding transmission lines can help connect high-quality solar and wind resources in remote regions to centers of demand. In fact, as of the end of 2021, over 900 gigawatts of solar and wind capacity (notably more than the country’s current renewable capacity) were queued for grid interconnection.
Electrification
Visualized: How the Power Grid Works
How does electricity get from the power plant to our homes? This infographic illustrates how the power grid works.
How Does the Power Grid Work?
Electricity is critical to our daily lives, but how does it get from the power plant to our homes?
The power grid is a complex interconnected system that powers the entire economy by carrying electricity from the source of generation and delivering it to our homes, offices, and factories. Sometimes referred to as “the world’s largest machine”, the grid is an important engineering marvel for the modern economy.
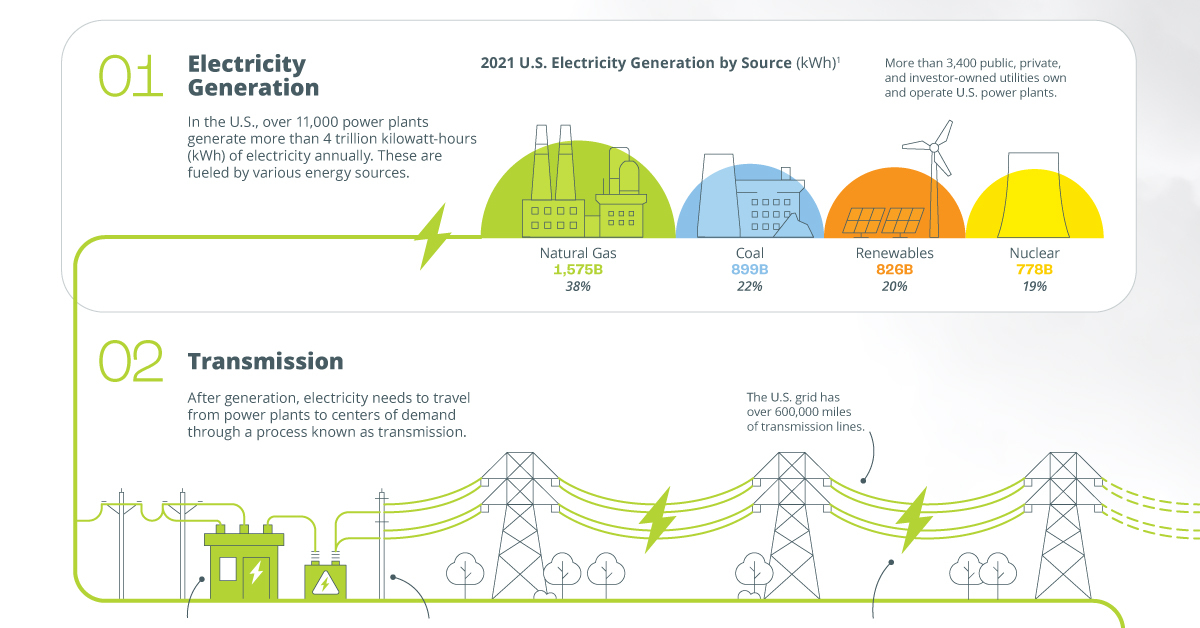
The above infographic from the National Public Utilities Council explains how the power grid works and highlights the three key components that make up the grid.
#1: Electricity Generation
The grid begins with power plants that generate electricity, typically owned and operated by public, private, or investor-owned utilities.
More than 11,000 power plants comprise the U.S. grid, generating over 4 trillion kilowatt-hours (kWh) of electricity annually. These are fueled by various energy sources:
| Energy Source | 2021 Electricity Generation (billion kWh) | % of Total |
|---|---|---|
| Natural Gas | 1,575 | 38% |
| Coal | 899 | 22% |
| Nuclear | 778 | 19% |
| Renewables | 826 | 20% |
| Other | 38 | 0.9% |
| Total | 4,116 | 100% |
Source: Energy Information Administration (EIA)
Natural gas and coal together accounted for 60% of annual electricity generation in 2021, followed by nuclear power. Wind was the largest renewable energy source, making up 10% of renewable electricity generation.
Each power generation technology has a different role to play in the larger power grid. For example, coal and nuclear power plants that cannot easily adjust their output are known as baseload power plants. Their output remains roughly the same throughout the day, and they are typically used to deliver the minimum amount of power needed to keep the grid running.
On the other hand, power generation from natural gas and intermittent renewable sources like wind and solar fluctuates throughout the day, typically peaking in the evenings when demand is at its highest. Natural gas plants are especially useful in meeting peaks in demand because their output can be adjusted relatively quickly.
#2: Transmission
After generation, electricity travels from power plants to centers of demand through a process known as transmission.
First, the electricity is sent from power plants to substations where step-up transformers convert it to extremely high voltages for transmission. High-voltage conversions help minimize how much electricity is lost as heat during transmission, which is roughly 5% in the United States. The higher the voltage, the less electricity is lost.
Transmission lines then carry this high-voltage electricity across long distances and are often interconnected across states. Line voltages can vary from 69,000 volts (69 kV) to 765kV, and transmission lines can be both overhead and underground.
Here’s a map of all high-voltage (345kV or greater) U.S. transmission lines:
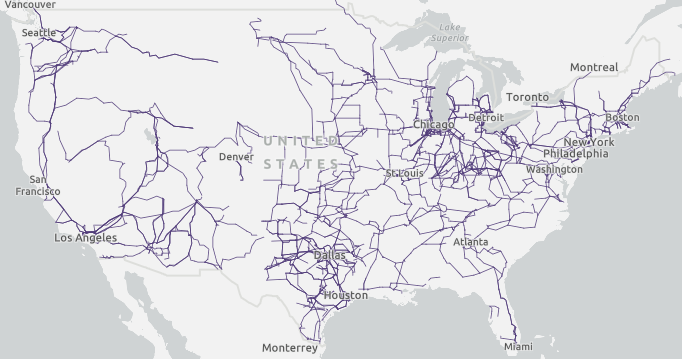
Source: U.S. Energy Atlas
Upgrading and expanding transmission infrastructure is key to achieving a decarbonized power grid, especially as utilities build solar and wind capacity in the sunniest and windiest parts of the country.
#3: Distribution and Consumption
Distribution is the final stage of delivering electricity, making up the last major component of the grid.
Simply put, distribution begins when transmission ends. It is the process of transporting power from the transmission system to individual customers. First, step-down transformers convert the high-voltage power from transmission lines into lower voltages that are suitable for use.
These transformers are connected to distribution poles, which are typically made of wood and used to carry electricity within centers of demand. There are about 180 million distribution poles in the U.S., and it’s likely that you encounter one every day, especially if you live in a city.
Distribution lines and poles deliver electricity to end consumers including households, office buildings, factories, and electric vehicles. Here’s a look at U.S. electricity sales to each end-use sector in 2021:
| Sector | 2021 retail electricity sales (billion kWh) | % of Total |
|---|---|---|
| Residential 🏠 | 1,480 | 39% |
| Commercial 🏢 | 1,320 | 35% |
| Industrial 🏭 | 987 | 26% |
| Transportation 🚙 | 6 | 0.2% |
| Total | 3,793 | 100% |
Source: EIA
Heating and cooling are the largest residential electricity uses. In the commercial sector, refrigeration and computers and office equipment account for over a quarter of electricity use. The transportation sector is by far the smallest electricity consumer, but these figures may change as electric vehicle sales rise.
At all times, the amount of electricity sent through the grid must match demand from end-use sectors. This is because all grids operate at a particular frequency (60 hertz in the United States). Excess power supply or demand can destabilize this frequency, potentially damaging grid infrastructure and triggering blackouts.
Modernizing the Power Grid
Just like machines that get old and need greasing, the U.S. power grid is aging and it needs an upgrade, especially as the power sector works to achieve 100% clean electricity by 2035.
The demand for electricity could accelerate in a scenario with high electrification, which involves switching from fossil fuel-powered technologies to electrical ones. For instance, one form of electrification is switching from gas-powered cars to electric cars.
To meet the growing demand for electricity, especially from clean energy sources, the U.S. will need to expand its transmission capacity and invest in modernizing the grid. In fact, reaching 100% clean electricity by 2035 could require anywhere from $330 billion to $740 billion in additional power system expenditures, according to a study by NREL.
Ultimately, upgrading and decarbonizing the grid are both pivotal to the U.S.’ climate goals, and this requires action from all stakeholders, from electric utilities to the government and end consumers.
The National Public Utilities Council is a collaborative body of industry experts coming together to solve decarbonization challenges in the power sector and the proud sponsor of the Decarbonization Channel.

-

 Electrification1 year ago
Visualized: How the Power Grid Works
-

 Energy Shift9 months ago
Ranked: The Cheapest Sources of Electricity in the U.S.
-

 Energy Shift1 year ago
Animated: 70 Years of U.S. Electricity Generation by Source
-

 Clean Energy1 year ago
Breaking Down Clean Energy Funding in the Inflation Reduction Act
-

 Emissions1 year ago
Visualizing Global Per Capita CO2 Emissions
-

 Decarbonization1 year ago
The U.S. Utilities Decarbonization Index
-

 Clean Energy1 year ago
The 30 Largest U.S. Hydropower Plants
-

 Clean Energy7 months ago
Breaking Down the $110 Trillion Cost of the Clean Energy Transition