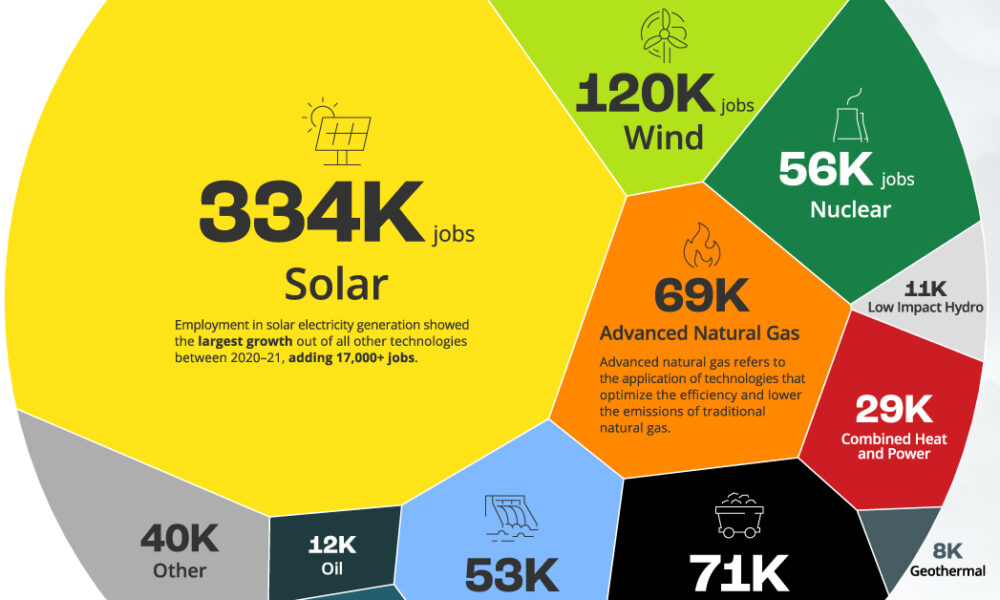
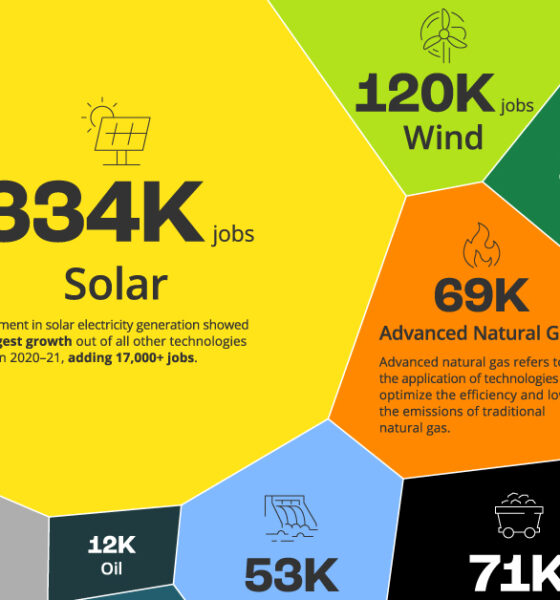
Exploring U.S. electricity generation jobs by technology with a focus on renewable energy and workforce development.
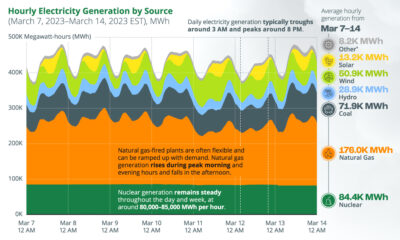

This chart tracks U.S. hourly electricity generation over one week, with various sources producing electricity at different times of the day.


How does electricity get from the power plant to our homes? This infographic illustrates how the power grid works.
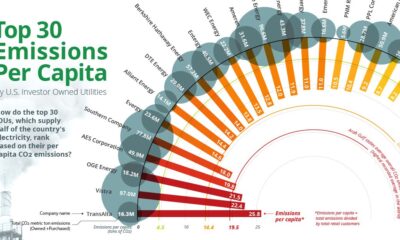

Emissions per Capita of the Top 30 U.S. Investor-Owned Utilities Approximately 25% of all U.S. greenhouse gas emissions (GHG) come from electricity generation. Subsequently, this means...
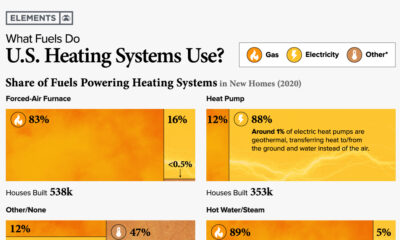

Charted: Home Heating Systems in the U.S. This was originally published on April 25, 2022, on Elements. Fossil fuel combustion for the heating of commercial and...
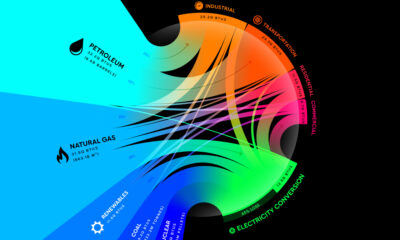

Breaking Down America’s Energy Consumption in 2020 This was originally published on July 6 2021, on Visual Capitalist. The United States relies on a complex mix...
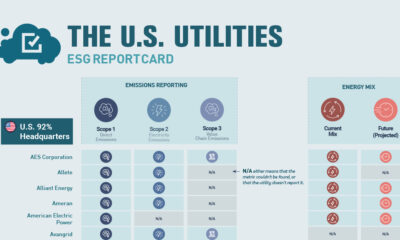

Tracked: The U.S. Utilities ESG Report Card This was originally posted on July 15, 2021, on Visual Capitalist. As emissions reductions and sustainable practices become more...
