Clean Energy
Breaking Down Clean Energy Funding in the Inflation Reduction Act
The following content is sponsored by the National Public Utilities Council
Breaking Down Clean Energy Funding in the Inflation Reduction Act
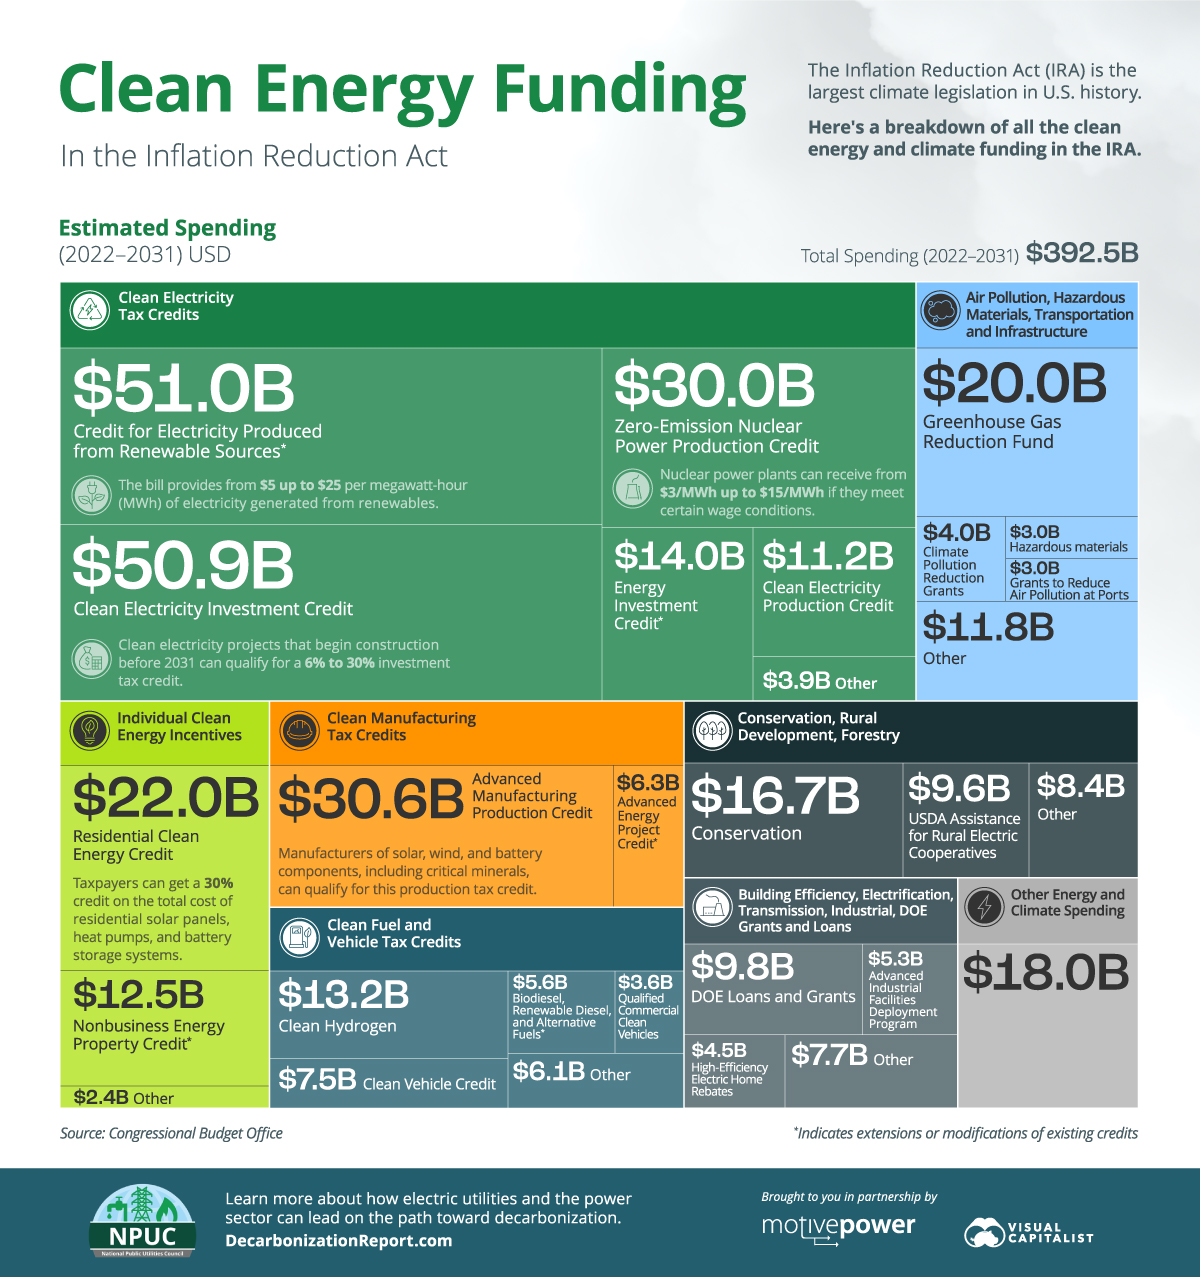
The Inflation Reduction Act (IRA), signed into law on August 16, 2022, is the largest climate legislation in U.S. history.
Along with fighting inflation and boosting domestic manufacturing, the IRA ultimately aims to help the U.S. achieve its goal of reaching net-zero emissions by 2050.
This infographic sponsored by the National Public Utilities Council breaks down the $392.5 billion in clean energy and climate spending in the Inflation Reduction Act, based on estimates from the Congressional Budget Office.
Note: The figures in the graphic and article refer to the IRA’s estimated spending for each program. Spending estimates tend to be lower than the total amount of funds allocated by the act.
Deconstructing the Inflation Reduction Act
The IRA’s clean energy and climate spending can be broken down into seven broader categories:
| Category | Estimated Spending (2022–2031, millions) |
|---|---|
| Clean Electricity Tax Credits | $160,940 |
| Air Pollution, Hazardous Materials, Transportation and Infrastructure | $41,870 |
| Individual Clean Energy Incentives | $36,878 |
| Clean Manufacturing Tax Credits | $36,877 |
| Clean Fuel and Vehicle Tax Credits | $35,995 |
| Conservation, Rural Development, Forestry | $34,681 |
| Building Efficiency, Electrification, Transmission, Industrial, DOE Grants and Loans | $27,270 |
| Other Energy and Climate Spending | $18,000 |
| Total | $392,511 |
Clean Electricity Tax Credits, which include the Clean Electricity Production Tax Credit (PTC) and Investment Tax Credit (ITC), account for the largest share of climate spending at 41% of the $392.5 billion.
Furthermore, the IRA mobilizes around $42 billion for programs aimed at air pollution, hazardous materials, and infrastructure. The Individual Clean Energy Incentives and Clean Manufacturing Tax Credits programs each receive $37 billion to incentivize residential clean energy use and domestic manufacturing of clean technology components.
Below, we’ll unpack the IRA’s clean energy spending in further detail.
Clean Electricity Tax Credits
Of the $161 billion of funding for Clean Electricity Tax Credits, $132 billion is for just three programs.
| Program | Estimated Spending (2022-2031, millions) |
|---|---|
| Credit for Electricity Produced From Renewable Resources* | $51,062 |
| Clean Electricity Investment Credit | $50,858 |
| Zero-Emission Nuclear Power Production Credit | $30,001 |
| Energy Investment Credit* | $13,962 |
| Clean Electricity Production Credit | $11,204 |
| Credit for Carbon Oxide Sequestration* | $3,229 |
| Other | $624 |
| Total | $160,940 |
*Indicates extensions or modifications of existing credits.
The Credit for Electricity Produced from Renewable Sources is a PTC that provides from $5 to $25 per megawatt-hour (MWh) of electricity generated from renewable facilities. Wind, solar, geothermal, marine, biomass, hydro, and landfill gas facilities are eligible for this credit.
The Clean Electricity Investment Credit is an ITC with a base credit of 6% (rising to 30% if other requirements are met) on the total cost of installed equipment for a zero-emissions power generation facility. Besides renewables, nuclear, fuel cells, and battery storage systems qualify for this credit.
Nuclear is set to get a $30 billion boost through the Zero-Emission Nuclear Power Production Credit, which offers from $3 up to $15 per MWh of electricity generated from nuclear reactors. This is applicable for all reactors in service in 2024 and continues through 2032.
Clean electricity projects can either claim the PTC or the ITC (not both). Projects with high capital costs are likely to benefit from the ITC. On the other hand, projects with high capacity factors could benefit from credits per unit of electricity from the PTC.
Air Pollution, Hazardous Materials, Transportation and Infrastructure
Nearly half the spending for programs in this category–around $20 billion—is for the Greenhouse Gas (GHG) Reduction Fund.
| Program | Estimated Spending (2022-2031, millions) |
|---|---|
| Greenhouse Gas Reduction Fund | $19,980 |
| Climate Pollution Reduction Grants | $4,050 |
| Hazardous Materials | $3,000 |
| Grants to Reduce Air Pollution at Ports | $3,000 |
| Neighborhood Access and Equity Grant Program | $2,900 |
| Use of Low-Carbon Materials | $2,150 |
| Low-Carbon Transportation Materials Grants | $1,700 |
| Clean Heavy-Duty Vehicles | $1,000 |
| Other | $4,090 |
| Total | $41,870 |
The GHG Reduction Fund, managed by the Environmental Protection Agency (EPA), aims to provide grants for clean energy and climate projects that reduce GHG emissions, with a focus on low-income and disadvantaged communities.
Similarly, other policies in this category provide the EPA with funding for grants to reduce various kinds of air pollution and curb hazardous material usage.
Individual Clean Energy Incentives
The IRA provides various tax credits to incentivize clean energy use and energy efficiency in American households.
| Program | Estimated Spending (2022-2031, millions) |
|---|---|
| Residential Clean Energy Credit | $22,022 |
| Nonbusiness Energy Property Credit* | $12,451 |
| New Energy Efficient Home Credit* | $2,043 |
| Energy Efficient Commercial Buildings Deduction | $362 |
| Total | $36,878 |
*Indicates extensions or modifications of existing credits.
The Residential Clean Energy Credit, accounting for $22 billion in spending, provides a 30% credit on the cost of residential clean energy equipment. This includes rooftop solar panels, geothermal heating systems, small wind turbines, and battery storage systems.
The Nonbusiness Energy Property Credit, now known as the Energy Efficient Home Improvement Credit, offers up to $3,200 annually for energy efficient home upgrades, including insulation, heat pumps, efficient doors, and more.
Clean Manufacturing Tax Credits
Besides energy generation, the IRA incentivizes domestic manufacturing of clean technologies with the following credits:
| Program | Estimated Spending (2022-2031, millions) |
|---|---|
| Advanced Manufacturing Production Credit | $30,622 |
| Extension of the Advanced Energy Project Credit | $6,255 |
| Total | $36,877 |
The Advanced Manufacturing Production Credit is a tax credit for the domestic production of solar and wind energy components, inverters, battery components, and critical minerals. The credit for critical minerals is permanent, unlike credits for other items, which will phase out in 2032.
Other Climate Funding in the IRA
In addition to the policies above, the IRA sanctions another $116 billion for clean energy and climate programs.
This includes incentives for clean hydrogen production, electric vehicle purchases, and alternative fuels. Furthermore, the Department of Energy receives around $9.8 billion for clean energy innovation and infrastructure loan and grant programs.
The act also invests in environmental conservation and rural development. It includes an estimated $9.6 billion in assistance for rural electric cooperatives, along with other incentives for energy efficiency and renewable energy.
With billions in climate funding, the Inflation Reduction Act is set to provide a significant boost to America’s clean energy plans. According to an assessment by the Department of Energy, the IRA could help reduce economy-wide GHG emissions to 40% below 2005 levels by 2030, marking a major milestone on the road to net-zero.
Clean Energy
Visualized: The Four Benefits of Small Modular Reactors
What advantages do small modular reactors offer compared to their traditional counterparts?

Visualized: The Four Benefits of Small Modular Reactors
Nuclear power has a crucial role to play on the path to net zero. Traditional nuclear plants, however, can be costly, resource-intensive, and take up to 12 years to come online.
Small modular reactors (SMR) offer a possible solution.
Created in partnership with the National Public Utilities Council, this infographic explores some of the benefits SMRs can offer their traditional counterparts. Let’s dive in.
The Four Key Benefits of SMRs, Explained
An SMR is a compact nuclear reactor that is typically less than 300 megawatts electric (MWe) in capacity and manufactured in modular units.
Here are some of the benefits they offer.
#1: Lower Costs
SMRs require a lower upfront capital investment due to their compact size.
SMRs can also match the per-unit electricity costs of traditional reactors due to various economic efficiencies related to their modular design, including design simplification, factory fabrication, and potential for regulatory harmonization.
#2: Quicker Deployment
Traditional nuclear plants can take up to 12 years to become operational. This is primarily due to their site-specific designs and substantial on-site labor involved in construction.
SMRs, on the other hand, are largely manufactured in factories and are location-independent, which minimizes on-site labor and expedites deployment timelines to as little as three years. This means they can be deployed relatively quickly to provide emissions-free electricity to the grid, supporting growing electricity needs.
#3: Siting Flexibility and Land Efficiency
SMRs have greater siting flexibility compared to traditional reactors due to their smaller size and modular design. In addition, they can utilize land more effectively than traditional reactors, yielding a higher output of electrical energy per unit of land area.
| Rolls-Royce SMR, UK (Proposed) | Median-Sized U.S. Nuclear Plant | |
|---|---|---|
| Capacity | 470 MW | 1,000 MW |
| Area Requirement | 10 Acres* | 832 Acres |
| Land/Space Efficiency | 47 MW/Acre | 1.2 MW/Acre |
*Estimated area requirement
Given their flexibility, SMRs are also suitable for installation on decommissioned coal power plant sites, which can support the transition to clean electricity while utilizing existing transmission infrastructure.
#4: Safety
SMRs have simpler designs, use passive cooling systems, and require lower power and operating pressure, making them inherently safer to operate than traditional reactors.
They also have different refueling needs compared to traditional plants, needing refueling every 3–7 years instead of the 1–2 years typical for large plants. This minimizes the transportation and handling of nuclear fuel, mitigating the risk of accidents.
The Road Ahead
As of early 2024, only five SMRs are operating worldwide. But with several other projects under construction and nearly 20 more in advanced stages of development, SMRs hold promise for expanding global emission-free electricity capacity.
With that said, certain obstacles remain for the wide-scale adoption of SMRs in the United States, which was particularly apparent in the 2023 cancellation of the NuScale SMR project.
To fully realize the benefits of SMRs and advance decarbonization efforts, a focus on financial viability, market readiness, and broader utility and public support may be essential.
Learn how the National Public Utilities Council is working toward the future of sustainable electricity.
Clean Energy
The $3 Trillion Clean Energy Investment Gap, Visualized
In this graphic, we explore the $3 trillion clean energy investment gap visualized by sector, according to BloombergNEF data.
The $3 Trillion Clean Energy Investment Gap, Visualized
Global investment in the clean energy transition grew by 17% in 2023, showing resilience despite geopolitical tensions, high interest rates, and inflation.
But was it enough to keep the world on track to hit net zero by 2050?
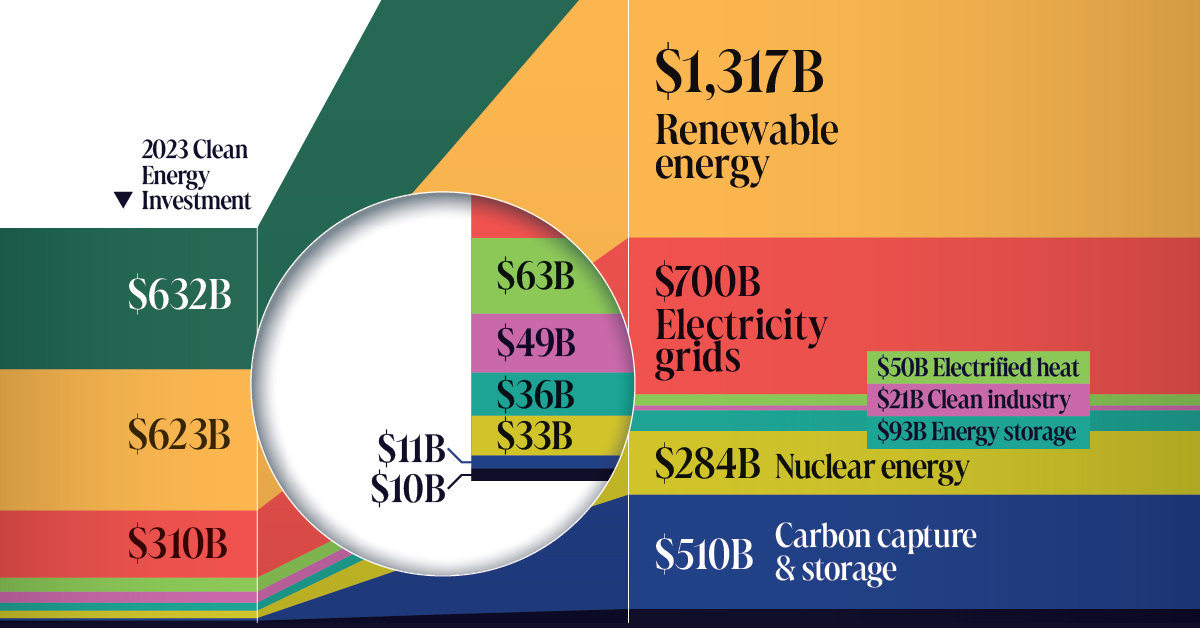
To answer this question, we compare 2023 clean energy investment by sector with what’s annually needed to reach net zero by 2050, in partnership with the National Public Utilities Council.
The Investment Gap, By Sector
According to BloombergNEF data, annual global investment in the energy transition is at an all-time high. Despite this, only the electrified heat and clean industry sectors are meeting the thresholds necessary to hit net zero by 2050.
| 2023 Investment | Required Annual Investment for Net Zero*, 2024–2030 | Investment Gap | |
|---|---|---|---|
| Electrified transport | $632B | $1,805B | $1,173B |
| Renewable energy | $623B | $1,317B | $694B |
| Electricity grids | $310B | $700B | $390B |
| Electrified heat | $63B | $50B | -$13B |
| Clean industry | $49B | $21B | -$28B |
| Energy storage | $36B | $93B | $57B |
| Nuclear energy | $33B | $284B | $251B |
| Carbon capture and storage (CCS) | $11B | $510B | $499B |
| Hydrogen | $10B | $62B | $52B |
| TOTAL | $1,767B | $4,842B | $3,075B |
*BloombergNEF’s Net-Zero 2050 Scenario
To stay on track for net zero by 2050, the yearly investments in electrified transport, renewable energy, power grids, and energy storage must more than double their current rates for the rest of the decade.
Hydrogen, nuclear, and carbon capture and storage (CCS) have an even steeper hill to climb and must grow 6, 9, and 46 fold, respectively.
The Path Forward
It’s important to note that despite the current annual investment gap of $3T, the clean energy industry continues to exhibit positive trends.
Investment in electrified transport, for instance, surpassed that in renewable energy for the first time in 2023, marking a win for the sector.
Emerging sectors also experienced robust expansion despite being furthest off-target. Investments in hydrogen tripled to $10B, CCS nearly doubled to $11B, and energy storage witnessed a 76% increase to reach $36B in 2023.
These encouraging developments underscore the industry’s potential to drive transformative change and pave the way for a more sustainable and resilient energy landscape in the years ahead.
Learn how the National Public Utilities Council is working toward the future of sustainable electricity.

-

 Electrification1 year ago
Visualized: How the Power Grid Works
-

 Energy Shift9 months ago
Ranked: The Cheapest Sources of Electricity in the U.S.
-

 Energy Shift1 year ago
Animated: 70 Years of U.S. Electricity Generation by Source
-

 Emissions1 year ago
Visualizing Global Per Capita CO2 Emissions
-

 Decarbonization1 year ago
The U.S. Utilities Decarbonization Index
-

 Clean Energy1 year ago
The 30 Largest U.S. Hydropower Plants
-

 Clean Energy7 months ago
Breaking Down the $110 Trillion Cost of the Clean Energy Transition
-
 Climate1 year ago
Visualizing the State of Climate Change