Climate
The Rise in America’s Billion-Dollar Extreme Weather Disasters
The following content is sponsored by the National Public Utilities Council
The Rise in U.S. Billion-Dollar Extreme Weather Disasters
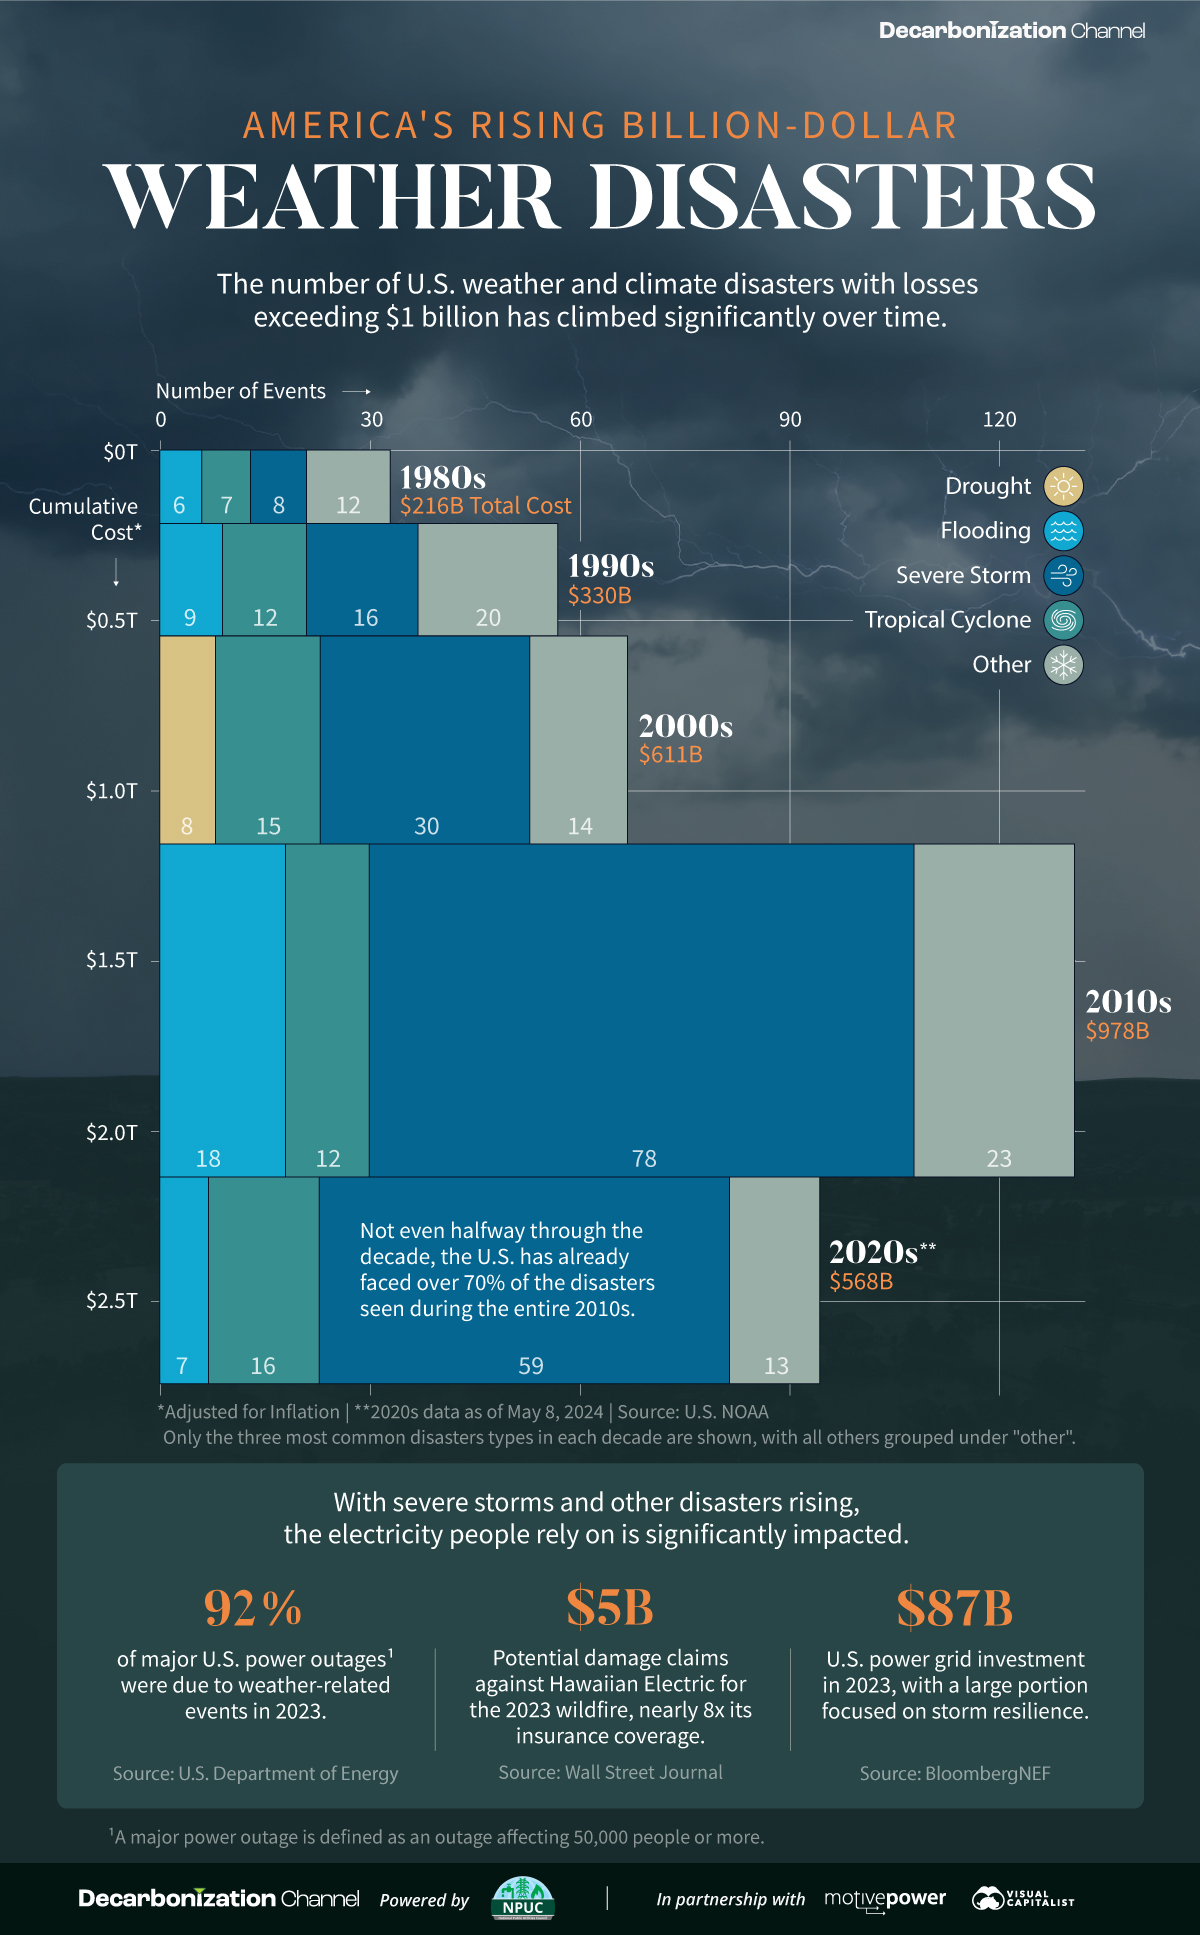
Since 1980, there have been 383 extreme weather or climate disasters where the damages reached at least $1 billion. In total, these disasters have cost more than $2.7 trillion.
Created in partnership with the National Public Utilities Council, this chart shows how these disasters have been increasing with each passing decade.
A Growing Concern
The U.S. National Oceanic and Atmospheric Administration (NOAA) tracks each disaster and estimates the cost based on factors like physical damages and time losses such as business interruption. They adjust all costs by the Consumer Price Index to account for inflation.
| Decade | Total No. of Events | Total Inflation-Adjusted Cost |
|---|---|---|
| 1980s | 33 | $216B |
| 1990s | 57 | $330B |
| 2000s | 67 | $611B |
| 2010s | 131 | $978B |
| 2020s* | 95 | $568B |
* Data is as of May 8, 2024.
Both the number and cost of extreme weather disasters has grown over time. In fact, not even halfway through the 2020s the number of disasters is over 70% of those seen during the entire 2010s.
Severe storms have been the most common, accounting for half of all billion-dollar disasters since 1980. In terms of costs, tropical cyclones have caused the lion’s share—more than 50% of the total. Hurricane Katrina, which made landfall in 2005, remains the most expensive single event with $199 billion in inflation-adjusted costs.
Electricity and Extreme Weather Disasters
With severe storms and other disasters rising, the electricity people rely on is significantly impacted. For instance, droughts have been associated with a decline in hydropower, which is an important source of U.S. renewable electricity generation.
Disasters can also lead to significant costs for utility companies. Hawaii Electric faces $5 billion in potential damages claims for the 2023 wildfire, which is nearly eight times its insurance coverage. Lawsuits accuse the company of negligence in maintaining its infrastructure, such as failing to strengthen power poles to withstand high winds.
Given that the utilities industry is facing the highest risk from extreme weather and climate disasters, some companies have begun to prepare for such events. This means taking steps like burying power lines, increasing insurance coverage, and upgrading infrastructure.
Learn how the National Public Utilities Council is working toward the future of sustainable electricity.
Climate
Mapped: Global Temperature Rise by Country (2022-2100P)
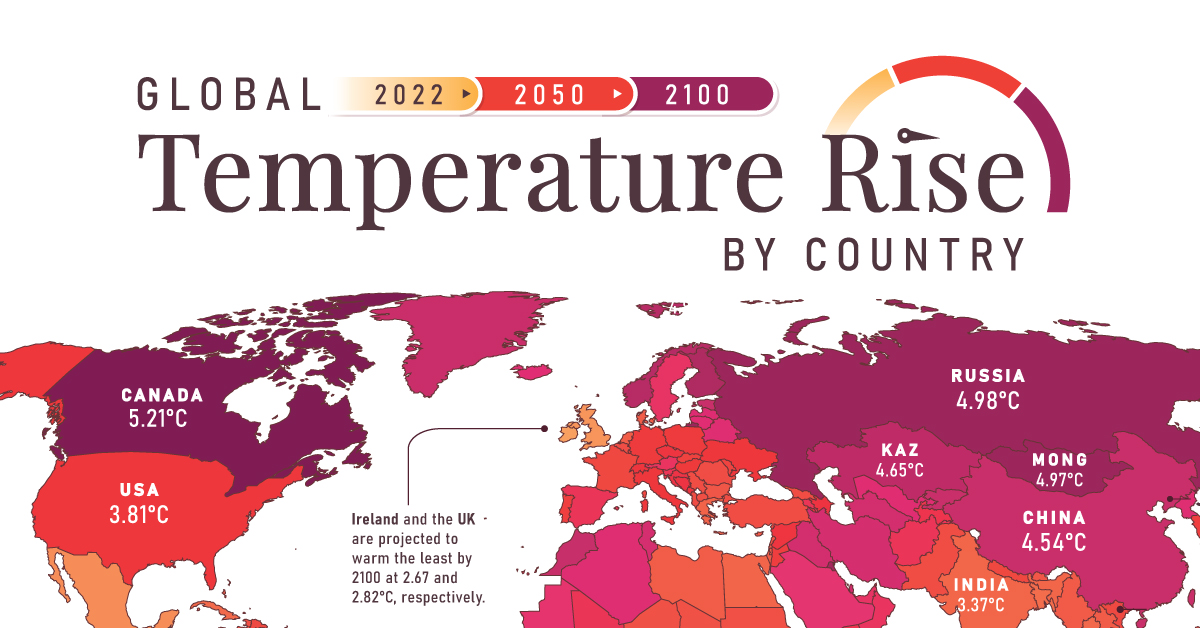
In this set of three maps, we show the global temperature rise on a national level for 2022, 2050, and 2100 based on an analysis by Berkeley Earth.
Mapped: Global Temperature Rise by Country (2022-2100P)
Many scientific authorities, such as the Intergovernmental Panel on Climate Change (IPCC), often discuss the need to limit planetary warming to 2°C above pre-industrial levels.
But did you know that this warming will not be evenly distributed throughout the globe due to factors such as geography, weather patterns, ocean currents, and the influence of human activities?
To discover the current and projected nuances of this uneven warming, these three maps created in partnership with the National Public Utilities Council visualize the global temperature rise by country, using new and updated data from Berkeley Earth.
Current State of Warming
The three maps above visualize warming relative to each country’s average 1850-1900 temperatures.
Looking at warming in 2022, we see that average national warming (i.e. warming excluding oceans) is already 1.81°C above those numbers, with Mongolia warming the most (2.54°C) and Bangladesh warming the least (1.1°C).
As the map depicts, warming is generally more accelerated in the Global North. One of the reasons for this is Arctic amplification.
Arctic amplification refers to the disproportionate heating experienced in the Arctic compared to the rest of the planet. This amplification is fueled by multiple feedback loops, including decreased albedo as ice cover diminishes, leading to further absorption of heat and exacerbating the warming effect.
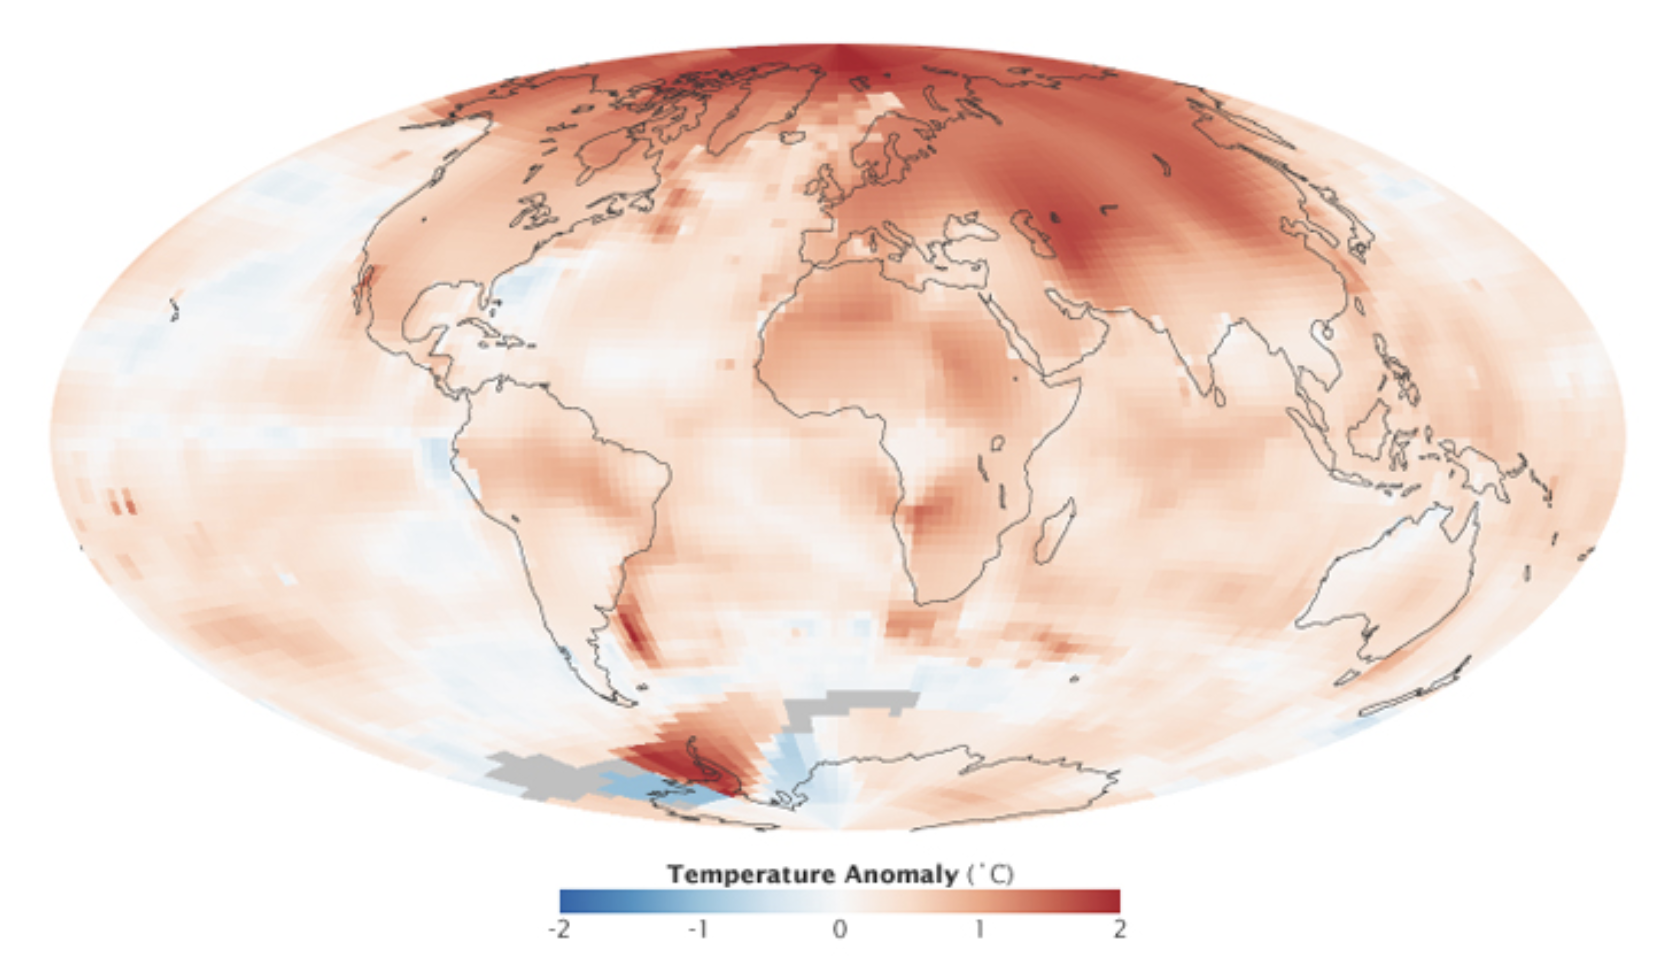
Arctic amplification. Source: NASA
Aside from modern-day observations, the effects of Arctic amplification are also clearly seen in climate models, where accelerated warming in countries such as Russia and Canada is seen through 2100.
Projected Warming in 2050 and 2100
Moving over to the second and third maps in the slides above, we discover country-level 2050 and 2100 warming projections.
These projections are based on the IPCC’s “middle-of-the-road” scenario, titled Shared Socioeconomic Pathway (SSP) 2-4.5. Out of the various established pathways, this one is the closest to expected emissions under current policies.
2050 Projections
Under the SSP2-4.5 scenario, average national warming is projected to be 2.75°C above average 1850-1900 temperatures in 2050. This includes Mongolia, with the most substantial warming of 3.76°C, and New Zealand, with the mildest warming of 2.02°C.
To put those temperatures into context, here are the risks that would likely accompany them, according to the IPCC’s latest assessment report.
- Extreme weather events will be more frequent and intense, including heavy precipitation and related flooding and cyclones.
- Nearly all ecosystems will face high risks of biodiversity loss, including terrestrial, freshwater, coastal and marine ecosystems.
- Accelerated sea level rise will threaten coastal cities, leading to mass displacement.
Let’s now take a look at 2100 projections, which would have significantly higher levels of risk unless fast and extreme mitigation and adaptation measures are implemented in the upcoming decades.
2100 Projections
2100 projections under the SSP2-4.5 scenario depict an average national warming of 3.80°C.
More than 55 countries across the globe are projected to have warming above 4°C in comparison to their 1850-1900 averages, and nearly 100 above 3.5°C.
Here is what those levels of warming would likely mean, according to the IPCC.
- 3-39% of terrestrial species will face very high risks of extinction.
- Water scarcity will considerably affect cities, farms, and hydro plants, and about 10% of the world’s land area will experience rises in both exceptionally high and exceptionally low river flows.
- Droughts, floods, and heatwaves will pose substantial threats to global food production and accessibility, eroding food security and impacting nutritional stability on a significant scale.
Generally, warming at this level is expected to pose substantial catastrophic risks to humanity, necessitating swift and bold climate action.
Learn more about how electric utilities and the power sector can lead on the path toward decarbonization here.
Climate
How Droughts Threaten the Future of Hydropower
This infographic explores how droughts are affecting U.S. hydroelectric generation and the future of hydropower.
How Droughts Threaten the Future of Hydropower
Hydropower is the largest source of renewable energy in the United States, accounting for 54% of the country’s renewable electricity generation.
However, dry conditions and droughts intensified by climate change are beginning to stress hydropower generation in some regions, casting a shadow of doubt over its future.
The above infographic sponsored by the National Public Utilities Council explores how prolonged dry conditions in some U.S. regions are threatening hydropower generation. This is part two of two in the Hydropower Series.
The U.S. Megadrought
According to a recent study, the American Southwest is currently experiencing its worst megadrought—defined as a drought that lasts two decades or longer—in 1,200 years.
The multi-decade drought that began in 2000 was exacerbated by extreme-dry conditions and a hot summer in 2021. Based on the soil moisture data (covering nine states) used in the study, the 22-year period was the region’s driest spell since 821 AD.
While climate change alone did not cause this, it accounted for 42% of the intensity of the 2000–2021 megadrought. Furthermore, it also made the year 2021 20% drier than it would have been.
As of 2022, California, Nevada, Arizona, Utah, and New Mexico were among the hardest-hit states by dry conditions, which has affected both their hydropower generation and reservoir storages.
Hydropower’s Droughtful Future
In most drought-hit states, hydropower’s share of electricity generation has fallen over the last two decades.
For instance, California’s hydropower generation dropped from 25.5 million megawatt-hours (MWh) in 2001 to 17.3 million MWh in 2022. Over that same period, hydropower’s share of California’s electricity generation fell from 13% to 8%.
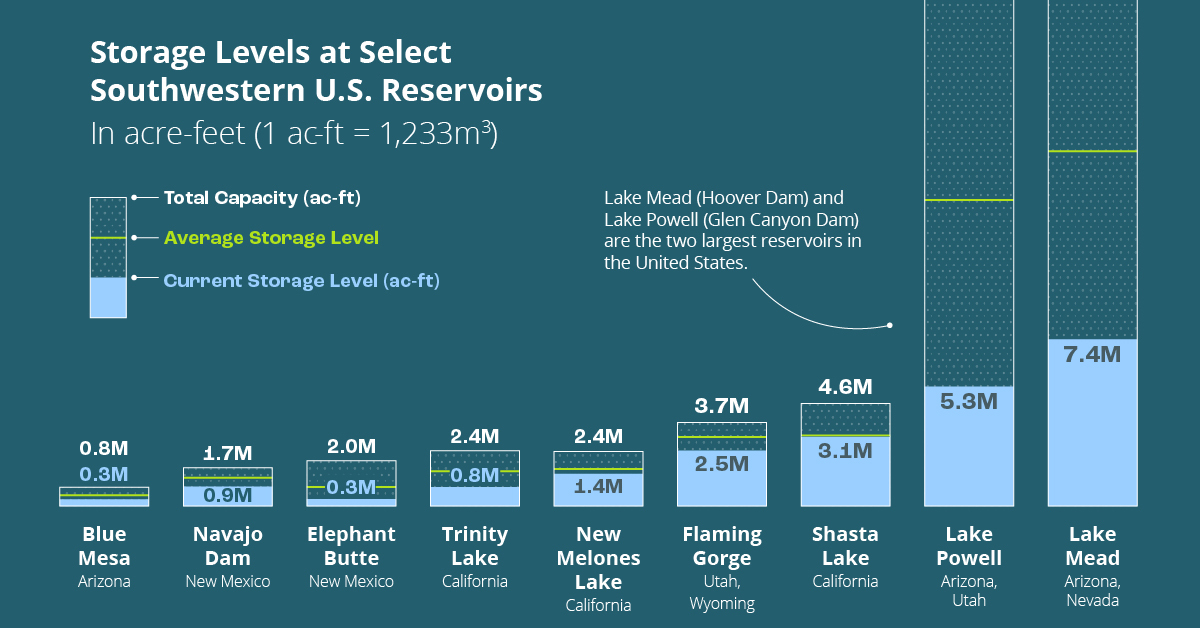
Besides the long-term declines in hydroelectric generation, water levels at some reservoirs are precariously low. Here’s a look at the water storage levels of select Southwestern reservoirs as of March 15, 2023:
| Reservoir | State | Total Storage Capacity (acre-feet) | Current Storage (acre-feet) | % Filled |
|---|---|---|---|---|
| Lake Mead | Arizona, Nevada | 26.1M | 7.4M | 28% |
| Lake Powell | Arizona, Utah | 24.3M | 5.3M | 22% |
| Shasta Lake | California | 4.6M | 3.1M | 67% |
| Flaming Gorge | Utah | 3.7M | 2.5M | 68% |
| New Melones Lake | California | 2.4M | 1.4M | 58% |
| Trinity Lake | California | 2.4M | 0.8M | 33% |
| Elephant Butte | New Mexico | 2.0M | 0.3M | 15% |
| Blue Mesa | Colorado | 0.8M | 0.3M | 38% |
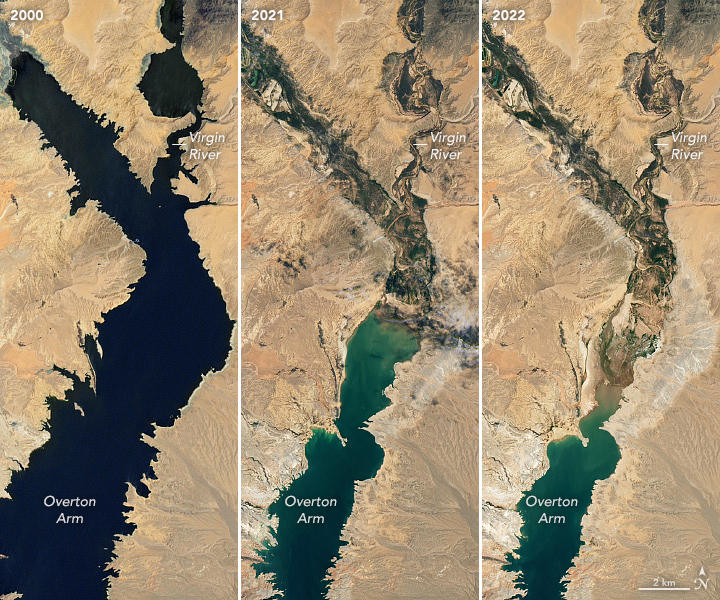
Notably, Lake Mead (Hoover Dam) and Lake Powell (Glen Canyon Dam)—the top two largest U.S. reservoirs by capacity, respectively—have alarmingly low storage levels with less than one-third of total storage filled.
To put that into perspective, these satellite images from NASA show a bird’s eye view of the Overton Arm, a part of Lake Mead, in 2000 compared to 2021 and 2022:
Similarly, prolonged dry conditions have pushed the storage levels of many other Southwestern reservoirs to well below their long-term averages.
The risks from these falling water levels are clear—if a reservoir’s elevation falls below a certain threshold (known as the minimum power pool), it can no longer support power generation. This occurred in 2021 when California’s Edward Hyatt Power Plant was shut down due to historically low water levels at Lake Oroville. Although the plant has resumed operations since then, the emergency shutdown is a recent example of hydropower’s vulnerability to drought.
Mitigating the Risks to Hydropower
Hydropower is one of the most reliable sources of renewable electricity and can operate at all times of the day. Furthermore, hydropower plants are important “black start” resources because they can independently kick-start electricity generation in the event of a blackout.
Consequently, a threat to the future of hydropower also poses risks for the power grid. In fact, in the summer of 2022, the NERC found that all U.S. regions covered by the Western grid interconnection were at risk of energy emergencies in the event of an extreme heat occurrence, because of dry conditions threatening hydropower.
Besides fighting climate change and working to reduce the frequency of intense droughts, here are three ways to combat the challenge facing hydropower while advancing decarbonization:
- Large-scale backup battery storage systems can be built to compensate for falling hydropower generation during severe droughts.
- Buildings and homes can be retrofitted and built with energy-efficient technologies to curb the overall demand for electricity and load on the grid.
- The power grid can be made more climate-resilient by expanding long-distance transmission lines and deploying more solar and wind power in interconnected regions.

-

 Energy Shift11 months ago
Ranked: The Cheapest Sources of Electricity in the U.S.
-

 Electrification2 years ago
Visualized: How the Power Grid Works
-

 Energy Shift1 year ago
Animated: 70 Years of U.S. Electricity Generation by Source
-

 Clean Energy9 months ago
Breaking Down the $110 Trillion Cost of the Clean Energy Transition
-

 Clean Energy1 year ago
Breaking Down Clean Energy Funding in the Inflation Reduction Act
-

 Clean Energy2 years ago
The 30 Largest U.S. Hydropower Plants
-

 Emissions2 years ago
Visualizing Global Per Capita CO2 Emissions
-

 Decarbonization2 years ago
The U.S. Utilities Decarbonization Index