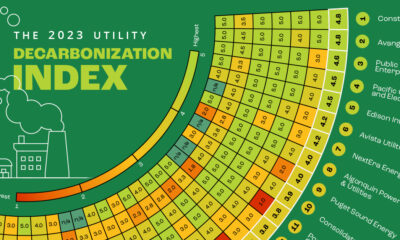

Here is a preview of our 2023 Utility Decarbonization Index, which tracks the decarbonization progress of the largest investor-owned utilities in America.
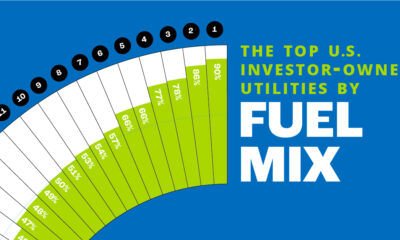

In this chart, we rank the top U.S. utilities by the share of low-carbon sources in their owned electricity generations.
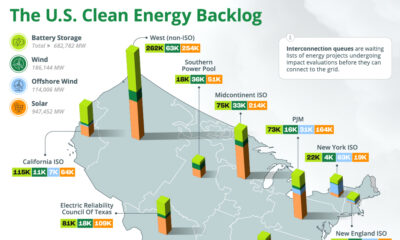

The U.S. has almost 2 million megawatts of clean energy capacity on hold in interconnection queues, seeking connection to the grid.


Can the transition from fossil fuels to clean, emission-free electricity sources be accomplished in a financially viable manner?
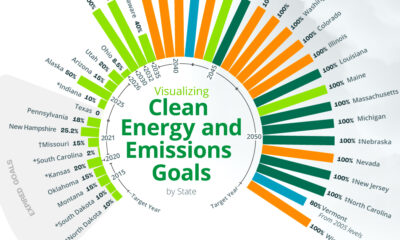

An overview of each U.S. state’s ultimate clean energy or GHG emission reduction goal, broken down by goal type and target year.
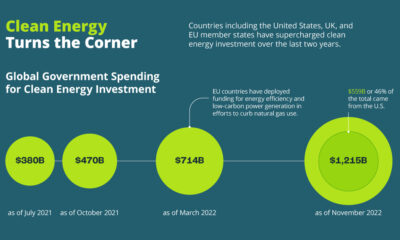

See how the energy crisis of 2022 accelerated the growth of clean energy.


This graphic breaks down the $392.5 billion in clean energy funding in the Inflation Reduction Act of 2022.
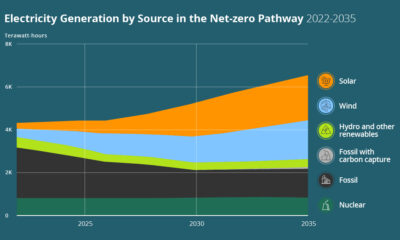

How can the U.S. achieve a 100% clean power sector? See the three key pillars of a decarbonized power sector in this infographic.
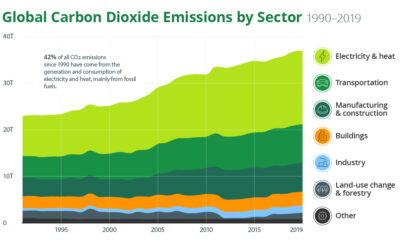

What is the current state of the climate change crisis, and how can we mitigate it? Find out in this infographic.


How does electricity get from the power plant to our homes? This infographic illustrates how the power grid works.


