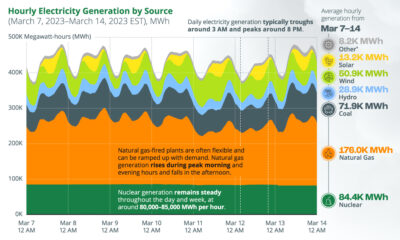

This chart tracks U.S. hourly electricity generation over one week, with various sources producing electricity at different times of the day.
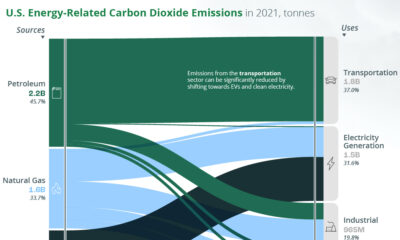

A look at the flow of energy-related CO2 emissions from the sources that generate energy to the sectors that use it.
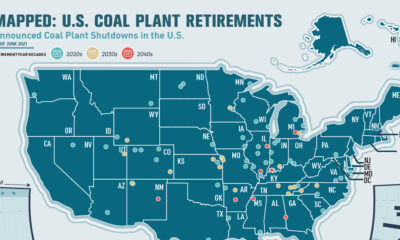

This infographic highlights announced coal plant closures in the U.S. and how much power will be affected.


Hydropower accounts for one-third of U.S. renewable power generation. Here are the 30 largest U.S. hydropower plants.


How does electricity get from the power plant to our homes? This infographic illustrates how the power grid works.
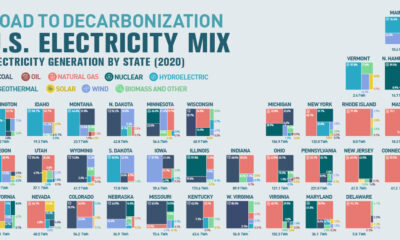

Road to Decarbonization: The United States Electricity Mix This was originally posted on August 31, 2021, on Visual Capitalist. The U.S. response to climate change and...
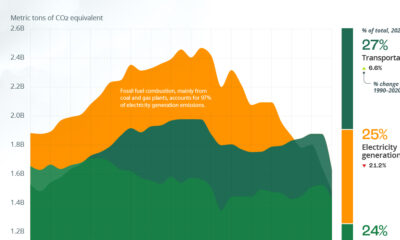

Visualizing U.S. Emissions by Sector Decarbonization efforts in the U.S. are ramping up, and in 2020, greenhouse gas (GHG) emissions were lower than at any point...
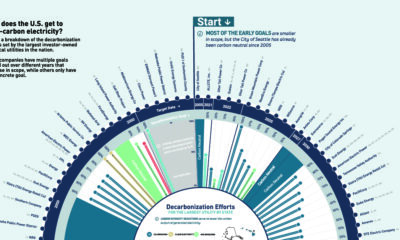

Decarbonization Targets for the Largest U.S. Utilities This was originally posted on April 23, 2021, on Visual Capitalist. The U.S. recently rejoined the Paris Climate Agreement...
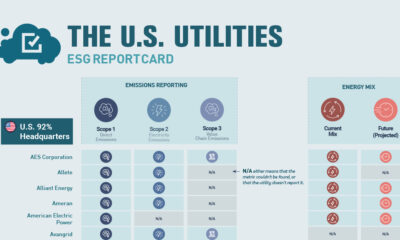

Tracked: The U.S. Utilities ESG Report Card This was originally posted on July 15, 2021, on Visual Capitalist. As emissions reductions and sustainable practices become more...


