
What is the current state of the climate change crisis, and how can we mitigate it? Find out in this infographic.


How does electricity get from the power plant to our homes? This infographic illustrates how the power grid works.
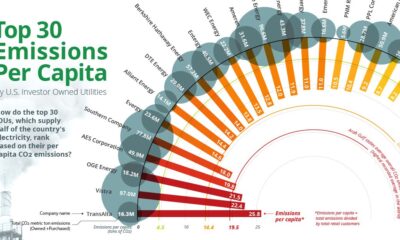

Emissions per Capita of the Top 30 U.S. Investor-Owned Utilities Approximately 25% of all U.S. greenhouse gas emissions (GHG) come from electricity generation. Subsequently, this means...


The U.S. Utilities Decarbonization Index With the Biden administration targeting a zero-emissions power sector for the U.S. by 2035, how are the nation’s largest electric power...
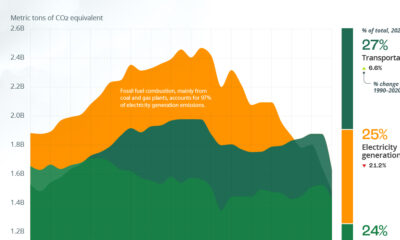

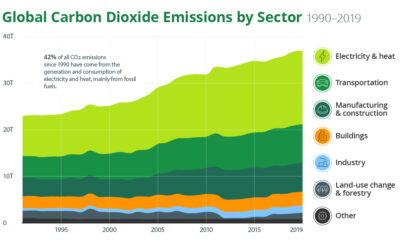
Visualizing U.S. Emissions by Sector Decarbonization efforts in the U.S. are ramping up, and in 2020, greenhouse gas (GHG) emissions were lower than at any point...


