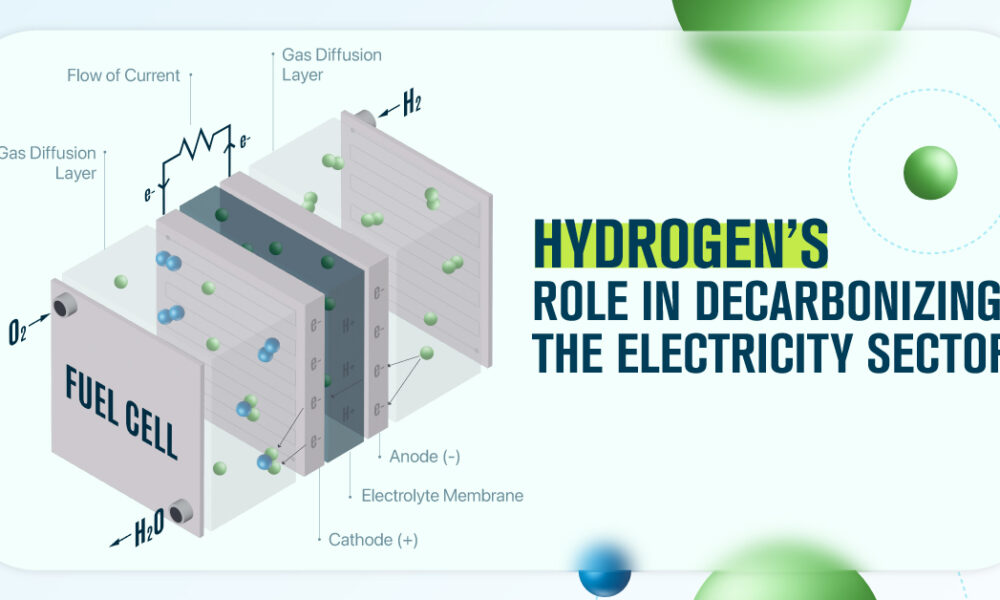
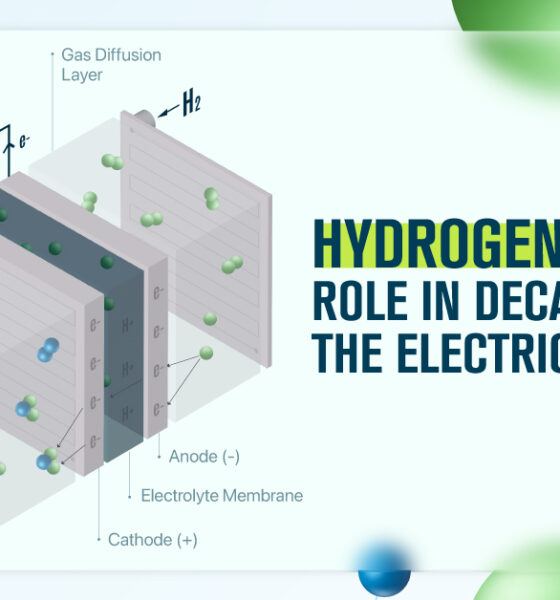
In this infographic, we discuss three ways hydrogen can support the decarbonization of the global electricity sector.


In this set of three maps, we show the global temperature rise on a national level for 2022, 2050, and 2100 based on an analysis by...


The clean energy transition will cost $110 trillion in global capital investments between 2021 and 2050. Here's that sum broken down by sector.
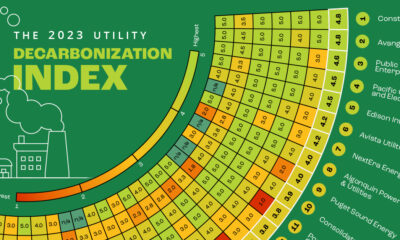

Here is a preview of our 2023 Utility Decarbonization Index, which tracks the decarbonization progress of the largest investor-owned utilities in America.
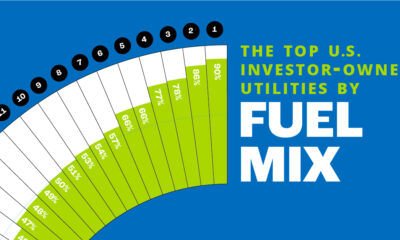

In this chart, we rank the top U.S. utilities by the share of low-carbon sources in their owned electricity generations.
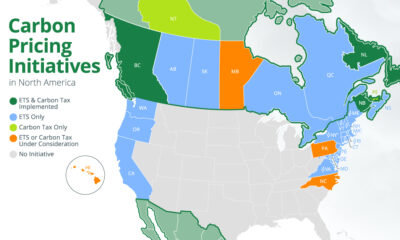

We map out all of the national and subnational carbon pricing initiatives in North America using data from the World Bank.
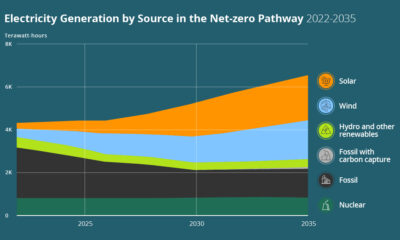

How can the U.S. achieve a 100% clean power sector? See the three key pillars of a decarbonized power sector in this infographic.


Hydropower accounts for one-third of U.S. renewable power generation. Here are the 30 largest U.S. hydropower plants.
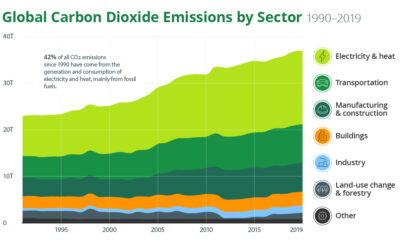

What is the current state of the climate change crisis, and how can we mitigate it? Find out in this infographic.


The U.S. Utilities Decarbonization Index With the Biden administration targeting a zero-emissions power sector for the U.S. by 2035, how are the nation’s largest electric power...
