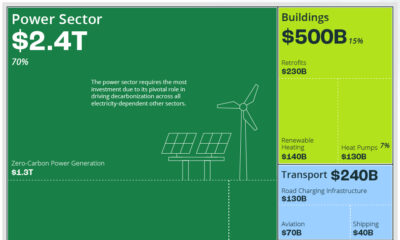

The clean energy transition will cost $110 trillion in global capital investments between 2021 and 2050. Here's that sum broken down by sector.
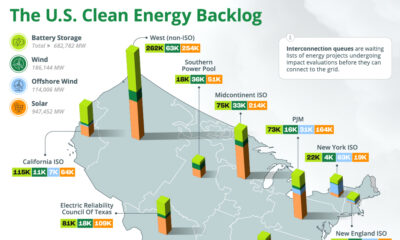

The U.S. has almost 2 million megawatts of clean energy capacity on hold in interconnection queues, seeking connection to the grid.
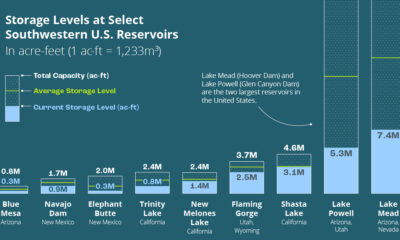

This infographic explores how droughts are affecting U.S. hydroelectric generation and the future of hydropower.
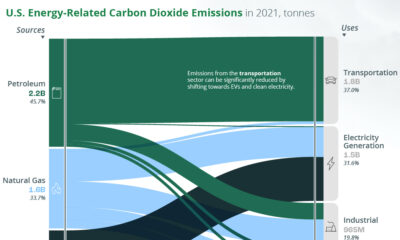

A look at the flow of energy-related CO2 emissions from the sources that generate energy to the sectors that use it.
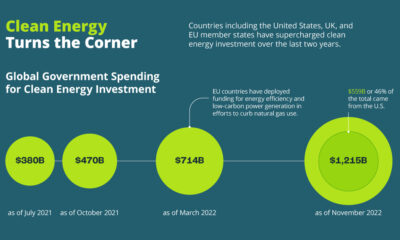

See how the energy crisis of 2022 accelerated the growth of clean energy.
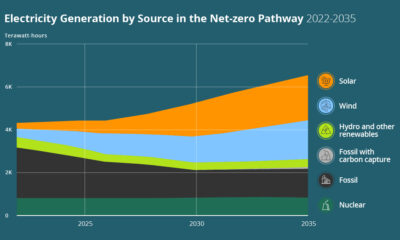

How can the U.S. achieve a 100% clean power sector? See the three key pillars of a decarbonized power sector in this infographic.
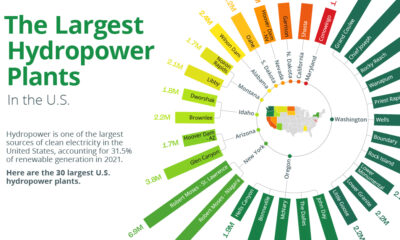

Hydropower accounts for one-third of U.S. renewable power generation. Here are the 30 largest U.S. hydropower plants.
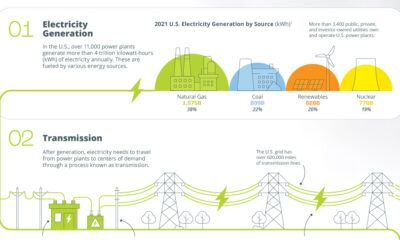

How does electricity get from the power plant to our homes? This infographic illustrates how the power grid works.
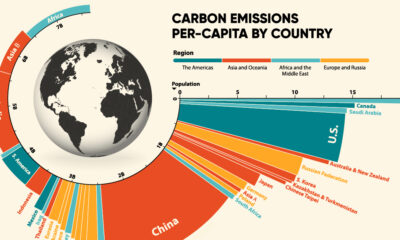

Highest Per Capita CO2 Emissions This was originally published on December 1, 2021, on Visual Capitalist. Developing countries like China, India, and Russia are some of...