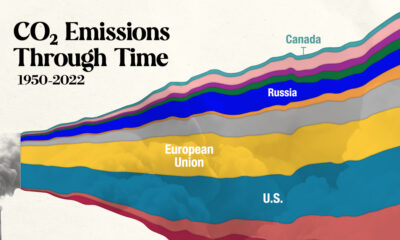

In this streamgraph, we break down global CO2 emissions between 1950 and 2022 using data from Berkeley Earth and Global Carbon Project.
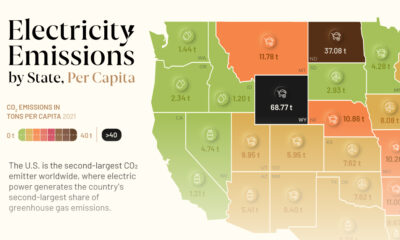

This graphic showcases electricity emissions by state, highlighting each state's largest source of power.


