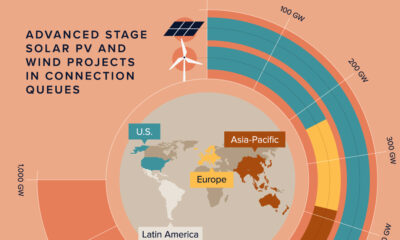

Streamlining processes, investing in infrastructure, and promoting local manufacturing can pave the way for wind and solar adoption.
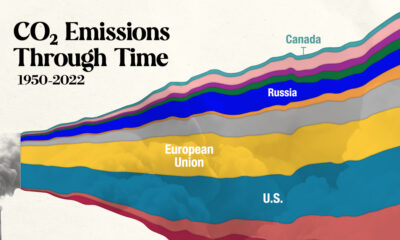

In this streamgraph, we break down global CO2 emissions between 1950 and 2022 using data from Berkeley Earth and Global Carbon Project.
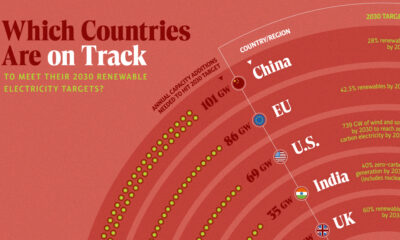

In this graphic, we visualize whether major electricity-consuming countries are on track to meet their 2030 renewable energy targets.


