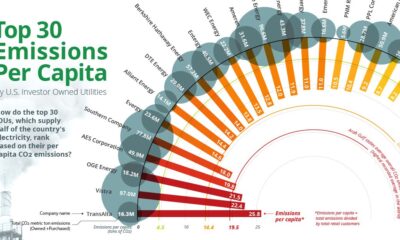

Emissions per Capita of the Top 30 U.S. Investor-Owned Utilities Approximately 25% of all U.S. greenhouse gas emissions (GHG) come from electricity generation. Subsequently, this means...
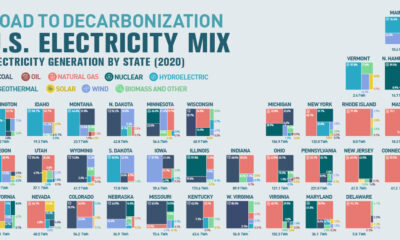

Road to Decarbonization: The United States Electricity Mix This was originally posted on August 31, 2021, on Visual Capitalist. The U.S. response to climate change and...

More carbon in the atmosphere is creating a hotter world—and gradually fuelling both climate change and instances of wildfires.
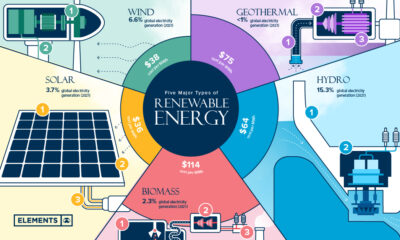

Renewable energy is the foundation of the ongoing energy transition. What are the key types of renewable energy, and how do they work?
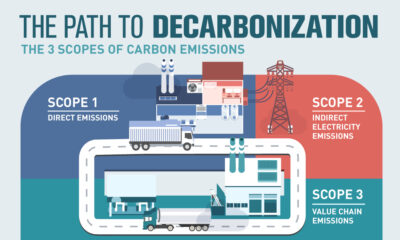

What Carbon Emissions Are Part Of Your Footprint? This was originally posted on April 9, 2021, on Visual Capitalist. With many countries and companies formalizing commitments...
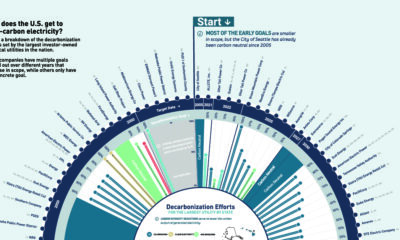

Decarbonization Targets for the Largest U.S. Utilities This was originally posted on April 23, 2021, on Visual Capitalist. The U.S. recently rejoined the Paris Climate Agreement...
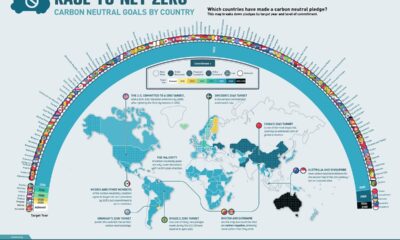

Race to Net Zero: Carbon Neutral Goals by Country This was originally posted on July 8, 2021, on Visual Capitalist. The time to talk about net...


More carbon in the atmosphere is creating a hotter world—and gradually fuelling both climate change and instances of wildfires.


