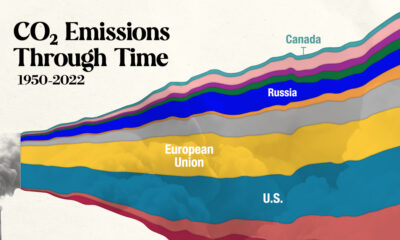

In this streamgraph, we break down global CO2 emissions between 1950 and 2022 using data from Berkeley Earth and Global Carbon Project.
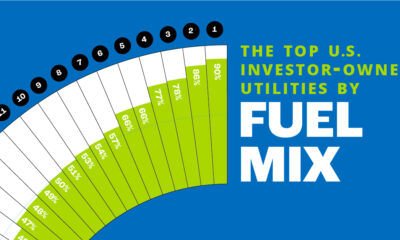

In this chart, we rank the top U.S. utilities by the share of low-carbon sources in their owned electricity generations.
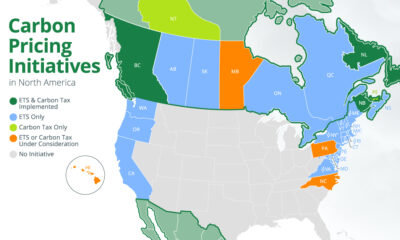

We map out all of the national and subnational carbon pricing initiatives in North America using data from the World Bank.
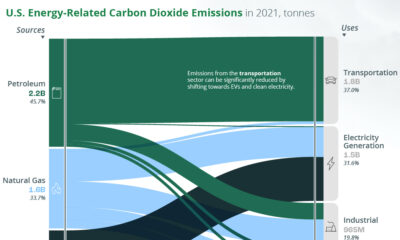

A look at the flow of energy-related CO2 emissions from the sources that generate energy to the sectors that use it.

More carbon in the atmosphere is creating a hotter world—and gradually fuelling both climate change and instances of wildfires.